Research Article - (2022) Volume 13, Issue 12
Abstract
Lung cancer is the second most dangerous disease worldwide which is curable if its diagnosis is done in earlier stages. Even with the rise in cancer diseases, researches have shown that the mortality rate of cancer patients is less. For the treatment of cancer patients, Machine learning and Artificial Intelligence (AI) have been researched and employed for the early detection of this disease in the past years. Biomedical image processing and detection of data have been used in combination in order to devise new techniques. In this paper, image classification was performed and machine learning algorithms were applied on lung cancer disease dataset to calculate measures such as accuracy, sensitivity, etc. K-Nearest Neighbour (KNN), Random forest and Support Vector Machine (SVM) algorithms have been used to analyze the initial stage lung cancer by applying these on the lung cancer dataset.
Keywords
Lung cancer, Artificial Intelligence (AI), K-Nearest Neighbour (KNN), Support Vector Machine (SVM), Random forest
Introduction
Death rate of lung cancer is more as compared to deaths due to other cancers; this is due to the reason that detection of lung cancer at early stages is difficult. Through possible early detection of the disease it can be treated within time and lives could be saved. Computed Tomography (CT) imaging (Gindi A, et al., 2014) has been by far the most trusted and accurate way of detecting cancer development in lungs since it is able to disclose any suspected as well as unsuspected lung cancer nodules. However, precise detection is still a major hurdle because the intensity in CT images are different and this lead to errors in the analysis of the anatomical structure by radiologists and investigators. To overcome this problem computer aided diagnosis has become a major supporting method (Xiuhua G, et al., 2011). Apart from this, research is continuously being conducted in this area of detection of lung cancer to achieve an accuracy of 100% in detection. In this paper, advanced technologies used for prediction of lung cancer using images from CT scan are discussed and an analysis is conducted on them to identify the best technique.
Materials and Methods
3 classifiers (KNN, Random forest and SVM) were used for the classification of image dataset following the development of machine learning pipeline, and later the performance of these classifiers is observed based on their accuracy and F1 scores (Suzuki K, et al., 2006).
Earlier a model with Linear Discriminant Analysis (LDA) used as classifier and for segmentation, optimal thresh holding was proposed by Aggarwal T, et al., 2015 to provide classification between nodules and lung anatomy structure. This system provided a 97.14% sensitivity, 84% accuracy and 53.33% specificity. At the cost of reduced sensitivity, use of convolution neural network in the Computer-Aided Design (CAD) system was experimented by Jin XY, et al., 2016. This system yielded 84.6% of accuracy, 82.5% of sensitivity and an increased specificity of 86.7%.
A similar effort was made by Sangamithraa PB and Govindaraju S, 2016 to group the dataset prior to classification, wherein clustering or segmentation was done through K mean unsupervised learning based on certain characteristics while implementing a back propagation network for classification.
Many other technologies have also been employed time and over for the detection of lung cancer nodules like the system developed by Roy TS, et al., 2015 which uses fuzzy interference system and active contour model. In this model, fuzzy interference system was used for classification and segmentation was performed via active contour model after image binarization. Further in this model image contrast enhancement was also done using gray transformation. A Gabor filter was used similarly by Ignatious S and Joseph R, 2015, for enhancing image quality prior to processing. With the use of this, accuracy higher than with models using region growing method and neural fuzzy model for segmentation was achieved (~90.1%).
Although the above mentioned models were able to achieve a high level of accuracy, purpose of differentiation among benign and malignant nodules was still not fulfilled. This was done with the model proposed by Rendon-Gonzalez E and Ponomaryov V, 2016. It used shape characteristics such as the circularity, fractal dimension, eccentricity, area and textural characteristics such as entropy, contrast, skewness, smoothness, energy, variance, mean for the purpose of training and classifying the Support Vector Machine which then identifies the nodules as benign or malignant.
Results and Discussion
The proposition of Ignatious S and Joseph R, 2015 is currently considered as the best solution based on the accuracy and its advantages. Use of marker controlled watershed segmentation method and Gabor filter for enhancing the image prior to processing made the detection of cancer nodule is much more accurate. The model is able to achieve a higher accuracy of 90.1% compared to other previously proposed models (Miah MB and Yousuf MA, 2015). However it still possesses some limitations as listed below:
• Lack of preprocessing techniques like image smoothing and noise removal, which could further benefit the detection.
• Classification of nodules into benign or malignant was not done.
The work reported in this research has tried to overcome all these limitations and the various steps involved in the machine learning pipeline in order to achieve the same are as below:
• Pre-processing of data
• Split the data into training, testing and validation
• Features extractions using various filters
• Model building on the features extracted
• Testing of data
• Result and conclusion
Filters
In this paper, we have used several filters (Armato I, et al., 2015) such as Gabor, Sobel and Gaussian etc. Some of them are as follows:
Gabor: Edge detection, feature extraction, texture analysis are few of the many uses of image processing applications where the Gabor filter which is a linear filter is used. This filter is useful to obtain an approximated visual of the properties of cells in the cortex of mammals.
Sobel: These filters calculate the gradient of image intensity for each pixel within image and are mostly used for edge detection.
Gaussian: Considered as one of the most reliable filters for image smoothing Gaussian filters are good at removing noise and detail. However, it is not as effective on removing salt and pepper noise.
Median: This filter is most of the times preferred over others due to its ability to preserve the edges while filtering out noise. Major application area of median filters is noise removal from images and signals.
Variance: The variance is a statistical measure of the amount of variation in the given variable. It is used primarily as a dimension reduction algorithm.
Research methodology
Preprocessing the data:
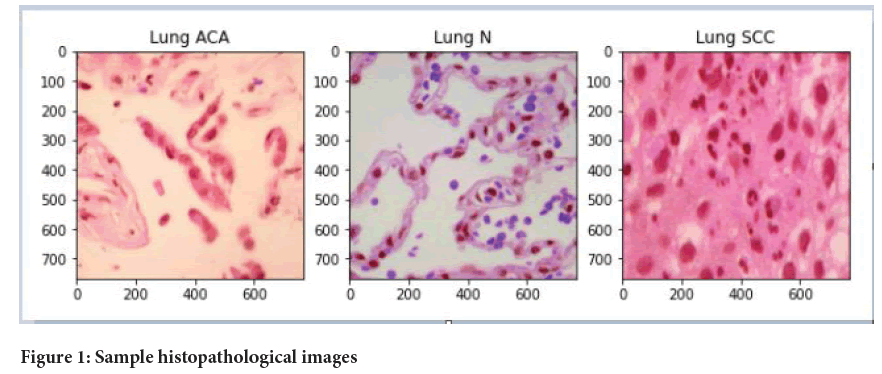
Image dataset: After collecting the data from Kaggle datasets, we ended up with a total of 15000 images, 5000 images of each type. Out of these images, we selected 1200 images (in which each 400 of these images belong to an each category i.e., normal, adenocarcinoma and squamous cell carcinomas) (Figure 1).
Figure 1: Sample histopathological images
Resizing the image: After selecting the images, the next step is to resize each image from their original size of 768 × 768 to 64 × 64 using open cv resize function and after resizing we add the images to a list.
Splitting the image dataset: In this step, we have split our data into two parts: Training and testing data respectively. We used 80% data for training and 20% for testing our models’ performance.
Features extraction:
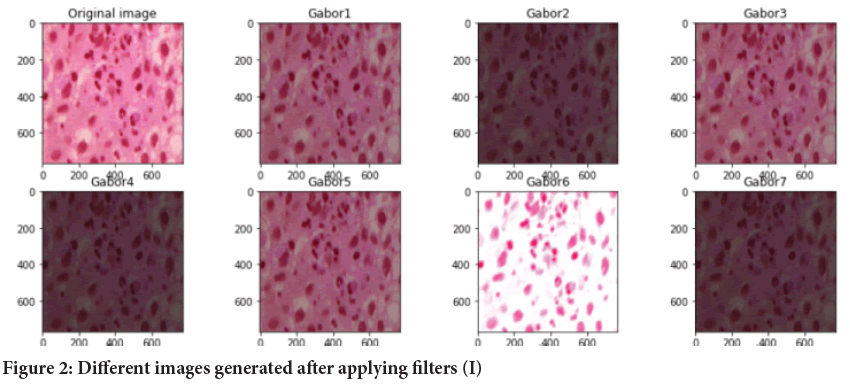
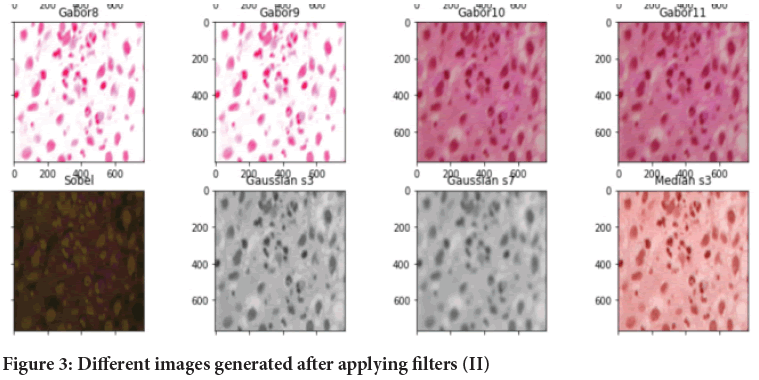
Image generation using filters: In this step, we are extracting the features from dataset for the training of model. We have use different variations of Gabor filters by changing the values of sigma, theta, lambda and gamma and we also have used other filters. On application of different filters we generate different images (Figures 2 and 3).
Figure 2: Different images generated after applying filters (I)
Figure 3: Different images generated after applying filters (II)
After generating the filtered Images, then each of them are reshaped along axis=0 and then add as a column to a data frame (Table 1).
| S.no | Pixel value | Gabor1 | Gabor2 | Gaussian s7 | Median s3 | Variance s3 |
|---|---|---|---|---|---|---|
| 0 | 0.980392 | 5 | 3 | 0.784155 | 0.980392 | 0.040184 |
| 1 | 0.568627 | 0 | 0 | 0.7840156 | 0.788235 | 0.030292 |
| 2 | 0.788235 | 3 | 2 | 0.784159 | 0.788235 | 0.012416 |
| 3 | 0.992157 | 4 | 3 | 0.783802 | 0.980392 | 0.045271 |
| 4 | 0.541176 | 0 | 0 | 0.783803 | 0.788235 | 0.034332 |
| 187 | 0.439216 | 0 | 0 | 0.742337 | 0.658824 | 0.046406 |
| 188 | 0.658824 | 3 | 2 | 0.742341 | 0.643137 | 0.011144 |
| 189 | 0.980392 | 5 | 3 | 0.742111 | 0.952941 | 0.059399 |
| 190 | 0.462745 | 0 | 0 | 0.742113 | 0.686275 | 0.044874 |
| 191 | 0.686275 | 3 | 2 | 0.742116 | 0.658824 | 0.011127 |
(12288 rows × 17 columns)
Table 1: Data frame for each original image after features extraction
Vector formation: After getting the list of all images after features extrac tion, each image data frame is again reshaped in along on axis=0 to get a single vector for each original image (Figure 4).
Figure 4: Feature vector for each original image
And the same procedure is followed for all the images and we get dataset which we can use to train our model.
Trainingmodels:Three different models were used respectively:
• KNN
• Random forest
• SVM (Support Vector Machine)
The main reason for trying all these models ranging from simple ones to complex is to identify the classifiers giving best performance for the dataset. Scikit learn package was used to import the libraries to train these three models.
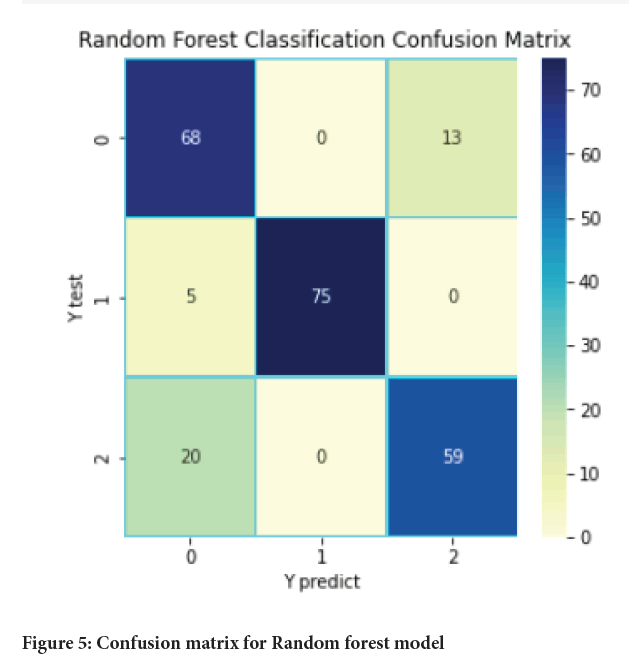
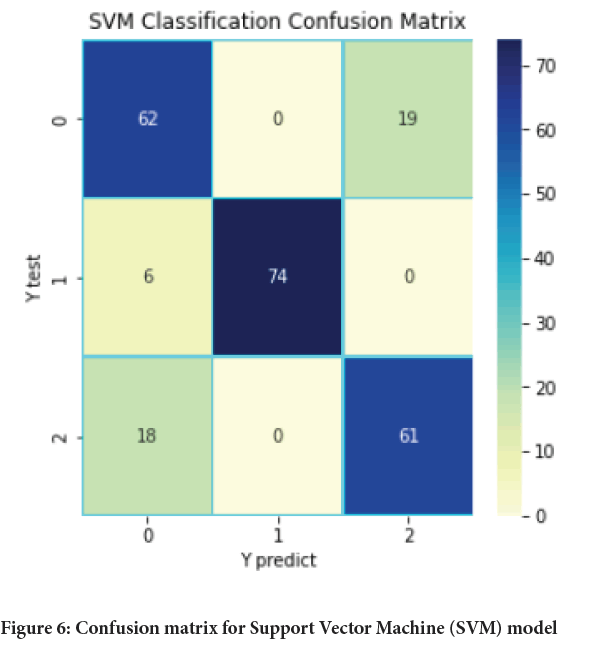
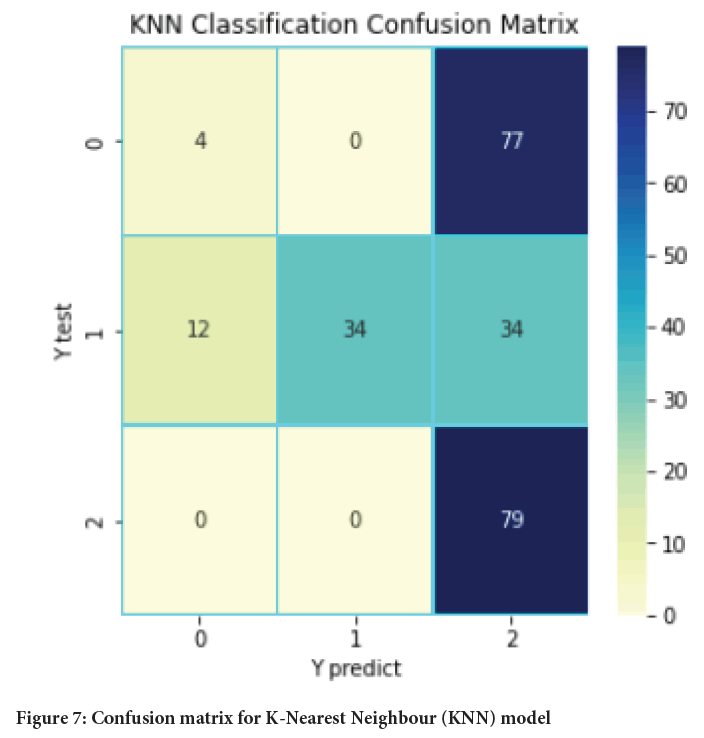
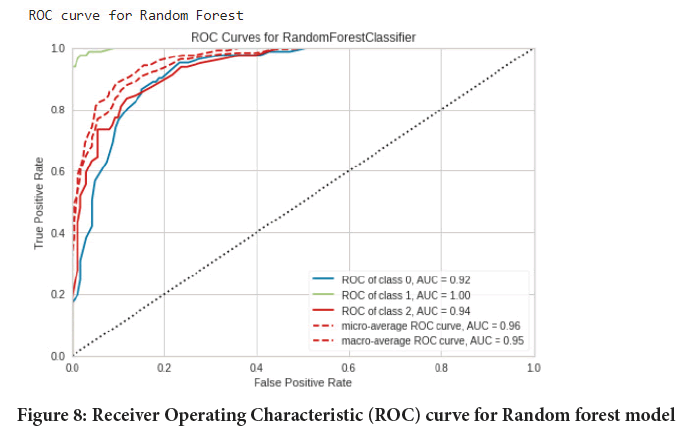
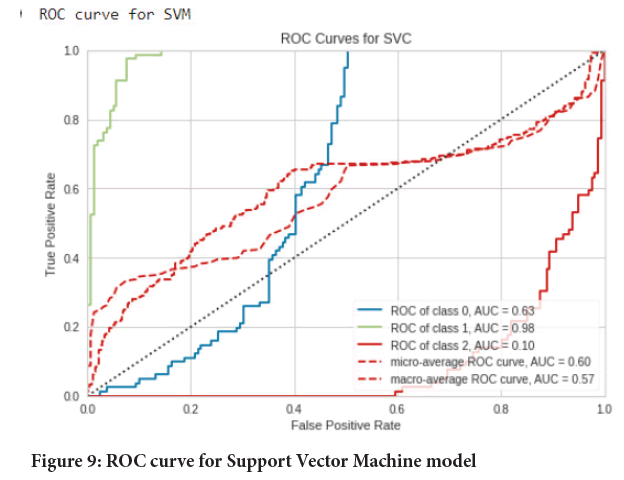
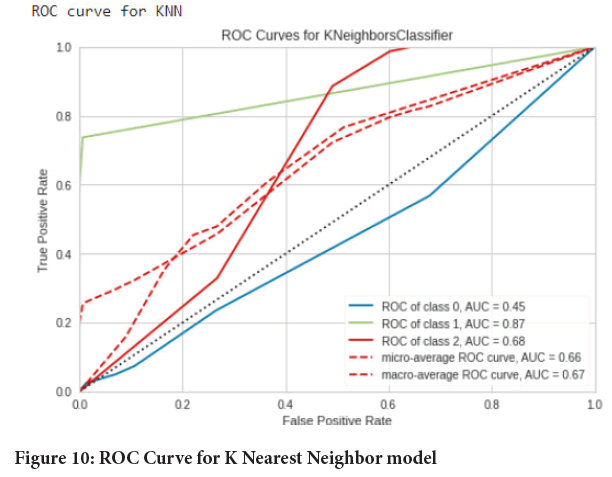
Testing performance of models: In this step the images were predicted/ classified into 3 categories namely normal, adenocarcinoma and squamous cell carcinomas using the respective trained models (Tables 2-4). Then the results were assessed using classification report, confusion matrix and Area under the Receiver Operating Characteristic (ROC-AUC) curve from scikit learn package. And in the end a comparison was done. The experimental results were (Figures 5-10):
| Precision | Recall | F1-score | Support | |
|---|---|---|---|---|
| Lung_aca | 0.731 | 0.84 | 0.782 | 81 |
| Lung_n | 1 | 0.938 | 0.968 | 80 |
| Lung_scc | 0.819 | 0.747 | 0.781 | 79 |
| Accuracy | - | - | 0.842 | 240 |
| Macro avg | 0.85 | 0.841 | 0.844 | 240 |
| Weighted avg | 0.85 | 0.842 | 0.844 | 240 |
Table 2: Result for Random forest model
| Precision | Recall | F1-score | Support | |
|---|---|---|---|---|
| Lung_aca | 0.721 | 0.765 | 0.743 | 81 |
| Lung_n | 1 | 0.925 | 0.961 | 80 |
| Lung_scc | 0.762 | 0.772 | 0.767 | 79 |
| Accuracy | - | - | 0.821 | 240 |
| Macro avg | 0.828 | 0.821 | 0.824 | 240 |
| Weighted avg | 0.828 | 0.821 | 0.824 | 240 |
Table 3: Result for Support Vector Machine (SVM) model
| Precision | Recall | F1-score | Support | |
|---|---|---|---|---|
| lung_aca | 0.25 | 0.049 | 0.082 | 81 |
| lung_n | 1 | 0.425 | 0.596 | 80 |
| lung_scc | 0.416 | 1 | 0.587 | 79 |
| accuracy | - | - | 0.487 | 240 |
| macro avg | 0.555 | 0.491 | 0.422 | 240 |
| weighted avg | 0.555 | 0.487 | 0.42 | 240 |
Table 4: Result for K-Nearest Neighbour (KNN) model
Figure 5: Confusion matrix for Random forest model
Figure 6: Confusion matrix for Support Vector Machine (SVM) model
Figure 7: Confusion matrix for K-Nearest Neighbour (KNN) model
Figure 8: Receiver Operating Characteristic (ROC) curve for Random forest model
Figure 9: ROC curve for Support Vector Machine model
Figure 10: ROC Curve for K Nearest Neighbor model
• Classification report
• Confusion matrices
• Receiver Operating Characteristic (ROC) curves
Conclusion
The main aim of this paper was to develop a model based on machine learning algorithm for identification and earlier detection of lung cancer more accurately. The extraction of cancer features using some initial features and machine learning algorithms was also done. Three algorithms namely KNN, Random forest and SVM were used and applied on the dataset for lung cancer and the results obtained with each of them were compared in terms of accuracy, precision, recall, F-measure, support, etc. With the help of above results and comparisons, it was concluded that among three models Random forest provides the best results with an accuracy of 84.2% which is followed by SVM with an accuracy of 82.1%.
Future Work
A lot of opportunities remain open with the work completed here. The models which have been developed during the course of this study could be integrated into software which will help in prediction of Lung cancer. The prototype software developed here could be further improved upon by increasing the speed of processing of the dataset and more features. The same method could be applied on different other types of diseases.
Author’s Contribution
Abhishek Gupta worked on modeling and running tests. Zuha prepared the manuscript and organized all the raw data obtained from the tests.
Israr Ahmad and Prof. Zeeshan ansari reviewed the manuscript.
References
- Gindi A, Attiatalla TA, Sami MM. A comparative study for comparing two feature extraction methods and two classifiers in classification of early stage lung cancer diagnosis of chest x-ray images. J Am Sci. 2014; 10(6): 13-22.
- Xiuhua G, Tao S, Zhigang L. Prediction models for malignant pulmonary nodules based-on texture features of CT image. Theory and Applications of CT Imaging and Analysis. 2011.
- Suzuki K, Kusumoto M, Watanabe SI, Tsuchiya R, Asamura H. Radiologic classification of small adenocarcinoma of the lung: radiologic-pathologic correlation and its prognostic impact. Ann Thorac Surg. 2006; 81(2): 413-419.
[Crossref] [Google Scholar] [Pubmed]
- Aggarwal T, Furqan A, Kalra K. Feature extraction and LDA based classification of lung nodules in chest CT scan images. International Conference on Advances in Computing, Communications and Informatics (ICACCI). 2015; 1189-1193.
- Jin XY, Zhang YC, Jin QL. Pulmonary nodule detection based on CT images using convolution neural network. 9th International Symposium on Computational Intelligence and Design (ISCID). 2016; 1: 202-204.
- Sangamithraa PB, Govindaraju S. Lung tumour detection and classification using EK-Mean clustering. International Conference on Wireless Communications, Signal Processing and Networking (WiSPNET). 2016: 2201-2206.
- Roy TS, Sirohi N, Patle A. Classification of lung image and nodule detection using fuzzy inference system. International Conference on Computing, Communication and Automation. 2015: 1204-1207.
- Ignatious S, Joseph R. Computer aided lung cancer detection system. Global Conference on Communication Technologies (GCCT). 2015: 555-558.
- Rendon-Gonzalez E, Ponomaryov V. Automatic Lung nodule segmentation and classification in CT images based on SVM. 9th International Kharkiv Symposium on Physics and Engineering of Microwaves, Millimeter and Sub millimeter Waves (MSMW). 2016; 1-4.
- Miah MB, Yousuf MA. Detection of lung cancer from CT image using image processing and neural network. International Conference on Electrical Engineering and Information Communication Technology (ICEEICT). 2015: 1-6.
- Armato I, McLennan GS, McNitt-Gray FR, Charles M. Data from LIDC-IDRI. The Cancer Imaging. 2015.
Author Info
Abhishek Gupta1, Zuha2*, Israr Ahmad3 and Zeeshan Ansari12Department of Electrical Engineering, Jamia Millia Islamia Central University, New Delhi, India
3Department of Mechanical Engineering, Aligarh Muslim University, Uttar Pradesh, India
Citation: Gupta A: A Study on Prediction of Lung Cancer Using Machine Learning Algorithms
Received: 01-Nov-2022 Accepted: 25-Nov-2022 Published: 02-Dec-2022, DOI: 10.31858/0975-8453.13.12.889-895
Copyright: This is an open access article distributed under the terms of the Creative Commons Attribution License, which permits unrestricted use, distribution, and reproduction in any medium, provided the original work is properly cited.
ARTICLE TOOLS
- Dental Development between Assisted Reproductive Therapy (Art) and Natural Conceived Children: A Comparative Pilot Study Norzaiti Mohd Kenali, Naimah Hasanah Mohd Fathil, Norbasyirah Bohari, Ahmad Faisal Ismail, Roszaman Ramli SRP. 2020; 11(1): 01-06 » doi: 10.5530/srp.2020.1.01
- Psychometric properties of the World Health Organization Quality of life instrument, short form: Validity in the Vietnamese healthcare context Trung Quang Vo*, Bao Tran Thuy Tran, Ngan Thuy Nguyen, Tram ThiHuyen Nguyen, Thuy Phan Chung Tran SRP. 2020; 11(1): 14-22 » doi: 10.5530/srp.2019.1.3
- A Review of Pharmacoeconomics: the key to “Healthcare for All” Hasamnis AA, Patil SS, Shaik Imam, Narendiran K SRP. 2019; 10(1): s40-s42 » doi: 10.5530/srp.2019.1s.21
- Deuterium Depleted Water as an Adjuvant in Treatment of Cancer Anton Syroeshkin, Olga Levitskaya, Elena Uspenskaya, Tatiana Pleteneva, Daria Romaykina, Daria Ermakova SRP. 2019; 10(1): 112-117 » doi: 10.5530/srp.2019.1.19
- Dental Development between Assisted Reproductive Therapy (Art) and Natural Conceived Children: A Comparative Pilot Study Norzaiti Mohd Kenali, Naimah Hasanah Mohd Fathil, Norbasyirah Bohari, Ahmad Faisal Ismail, Roszaman Ramli SRP. 2020; 11(1): 01-06 » doi: 10.5530/srp.2020.1.01
- Manilkara zapota (L.) Royen Fruit Peel: A Phytochemical and Pharmacological Review Karle Pravin P, Dhawale Shashikant C SRP. 2019; 10(1): 11-14 » doi: 0.5530/srp.2019.1.2
- Pharmacognostic and Phytopharmacological Overview on Bombax ceiba Pankaj Haribhau Chaudhary, Mukund Ganeshrao Tawar SRP. 2019; 10(1): 20-25 » doi: 10.5530/srp.2019.1.4
- A Review of Pharmacoeconomics: the key to “Healthcare for All” Hasamnis AA, Patil SS, Shaik Imam, Narendiran K SRP. 2019; 10(1): s40-s42 » doi: 10.5530/srp.2019.1s.21
- A Prospective Review on Phyto-Pharmacological Aspects of Andrographis paniculata Govindraj Akilandeswari, Arumugam Vijaya Anand, Palanisamy Sampathkumar, Puthamohan Vinayaga Moorthi, Basavaraju Preethi SRP. 2019; 10(1): 15-19 » doi: 10.5530/srp.2019.1.3

