Research Article - (2023) Volume 14, Issue 3
Abstract
In patients with Obstructive Sleep Apnea (OSA), Upper Airway (UA) collapse occurs when the forces of the UA muscles become less than those produced by negative pressures, resulting in loose soft tissue (uvula and surroundings) at the back of the mouth. Continuous Positive Airway Pressure (CPAP) at a predetermined titration pressure normally provides continuous pressurized and humidified air to prevent airway collapse. However, many patients cannot tolerate high titration pressures, which may have health implications, such as stroke, especially in patients diagnosed with cardiovascular disease. A Super-Imposed Pressure Oscillation (SIPO) technique was proposed to reduce the titration pressure by superimposing the oscillating pressure on the CPAP-reduced pressure. Using Magnetic Resonance Imaging (MRI) scans, this study focuses on developing a computer model to predict diagnostic parameters such as the Hydraulic Diameter (HD), Lateral Pharyngeal Wall (LPW) thickness, and Apnea-Hypopnea Index (AHI) under three scenarios: OSA, CPAP, and CPAP with SIPO. Head and neck MRI sessions were performed. UA obstruction is discussed in preparation for ANSYS (Analysis of Systems) analysis of the three scenarios at various times within the breath cycle. SIPO on CPAP showed significant improvement over CPAP treatment. Correlations between HD, AHI, LPW, and disease severity have been well established.
Keywords
Apnea-Hypopnea Index (AHI), Obstructive Sleep Apnea (OSA), Superimposed Pressure Oscillations (SIPO), Continuous Positive Airway Pressure (CPAP)
Introduction
Obstructive Sleep Apnea (OSA) normally results in various health implications that reduce the quality of life (Lopes C, et al., 2008). It is characterised by recurrent episodes of pharyngeal airway ob- struction and collapse during sleep (Zamot N, et al., 2020) which can occur either at the level of the uvula or the tongue (Abushab YA, et al., 2021) due to the lack of bone structure. Upper Airway (UA) obstruction may occur when the forces generated by UA negative pressures exceed the forces produced by the UA mus- cles (Daulatzai MA, 2011; Ashaat S, 2016). The tendency for UA obstruction and collapse increases during sleep in the supine pos- ition due to gravitational forces which pull the soft tissues towards the airway walls, reducing the breathing air gap (Dragonieri S, et al., 2015).
OSA patients may experience hundreds of apnea events per night (AbdulRahman I, et al., 2018) resulting in restless sleep which may lead to hyper somnolence and diabetes (Xu H, et al., 2020), arrhythmia (Roux F, et al., 2000), stroke, hypertension, memory loss, cardiovascular disease, and low sexual drive in men (Liu L, et al., 2015; Gami AS, et al., 2013). The pathophysiology of OSA appears to be the result of anatomical and neuromuscular susceptibility factors; however, the exact mechanism is not fully understood. UA collapse can be related to the positioning of the fat tissue on the lateral wall of the pharynx (Ward K, et al., 2014). However, previous studies were based on static inspections, which reflect only one point in time. UA obstruction is a dynamic pro- cess in patients with OSA and requires a time-dependent study to show a history of complete obstruction.
Continuous Positive Airway Pressure (CPAP) is considered the first standard treatment for patients diagnosed with moderate-to-severe OSA (Qureshi A, et al., 2003). However, there have been many rejections of CPAP owing to nasal congestion and dryness (Hui DS, et al., 2012). Furthermore, patients with cardio- vascular disease may experience stroke symptoms owing to high titration pressures (Haba-Rubio J, et al., 2015). The pharyngeal and UA muscle activities increase when stimulated by pressure oscillations. Super-Imposed Pressure Oscillation (SIPO) has been successfully proven to keep the UA open with no form of collapse during both inspiration and expiration and at reduced-titration CPAP settings (BaHammam AS, et al., 2014). This study focus- es on developing a computer model to predict some commonly used diagnostic parameters such as Hydraulic Diameter (HD), Apnea-Hypopnoea Index (AHI), and Lateral Pharyngeal Wall (LPW) under three scenarios: OSA, CPAP alone, and CPAP with SIPO.
Materials and Methods
Upper Airway (UA) constructions
All procedures were approved by the Ethics Committee of the Auckland University of Technology. Limited head and neck Mag- netic Resonance Imaging (MRI) scans were obtained for 10 OSA patients (seven males and three females). All participants were tested by an Ear, Nose, and Throat (ENT) specialist to examine their upper airways. The first two columns of Table 1 provide the demographic data for the participants including Column 1: Iden- tification number, sex (M or F), and age; Column 2: Body mass index (kg/m2) and neck circumference (Cm), age, and sex. All participants were New Zealand European with a mean age of 55.0 ± 2.6 years. The study excluded smokers, subjects with metallic implants including pacemakers, and those with surgical interven- tion and pregnancy.
| Pt. ID-gender and age | Original clinical data | Obstructed | Under CPAP | CPAP+SIPO | ||||||
|---|---|---|---|---|---|---|---|---|---|---|
| BMI-Neck | LPW mm | AHI Event/h | CPAP-Cm H2O | LPW mm | AHI | LPW mm | AHI | LPW mm | AHI | |
| 1-M43 | 29.1-42 | 34.8 | 36.7 | 13 | 38.1 | 77 | 36.5 | 61 | 35.01 | 51 |
| 2-M60 | 28.9-43 | 33.1 | 44 | 12 | 37.81 | 75 | 36.13 | 57 | 33.21 | 47 |
| 3-F42 | 61.8-52 | 41.7 | 95 | 10 | 47.3 | 102.5 | 46.2 | 94 | 41.82 | 87.5 |
| 4-M60 | 35.1-49 | 39 | 15 | 11 | 42.15 | 87 | 40.68 | 83 | 39.3 | 72 |
| 5-M54 | 33.4-44 | 35.87 | 15.6 | 11 | 39.41 | 72 | 38.2 | 69 | 36.2 | 58 |
| 6-M48 | 38.9-53 | 35.47 | 73 | 7 | 37.8 | 68.8 | 36.46 | 57.5 | 35.64 | 53.5 |
| 7-M60 | 36.1-46 | 35.72 | 29 | 12 | 39.7 | 90 | 37.5 | 75 | 35.9 | 62 |
| 8-F662 | 33.0-38 | 38.4 | 2 | 4 | 41.5 | 95 | 41.1 | 93 | 38.51 | 77 |
| 9-M66 | 35.5-48 | 33.4 | 22 | 6 | 38.2 | 82 | 37.22 | 73 | 34.1 | 55 |
| 10-F55 | 34.0-49 | 36.73 | 63 | 6 | 40.2 | 82.5 | 38.1 | 70 | 36.8 | 63 |
| Mean ± SE | 36.6 ± 3.0 | 36.42 ± 0.84 | 39.5 ± 9.3 | 9.2 ± 1.0 | 40.22 ± 0.92 | 83.18 ± 3.35 | 38.81 ±0.98 | 73.25 ±4.23 | 36.65 ± 0.82 | 62.6 ± 4.02 |
Note: OSA: Obstructive Sleep Apnea; LPW: Lateral Pharyngeal Wall; AHI: Apnea-Hypopnea Index; CPAP: Continuous Positive Airway Pressure; SIPO: Super-Imposed Pressure Oscillation; BMI: Body Mass Index; SE: Standard Error
Table 1: Demographic data for ten OSA participants with the modelling results for LPW and AHI under OSA obstruction, CPAP and CPAP with SIPO
MRI data of the UA were collected by a registered radiographer at the Uni- versity of Auckland Centre for Advanced MRI. Each participant assumed a recumbent position within the MRI scanner, with the coil positioned over the head of the subject. Figure 1shows a sample of the collected MRI data scan for the UA, indicating the region of interest, that is, the nasopharynx, oropharynx, and laryngopharynx.
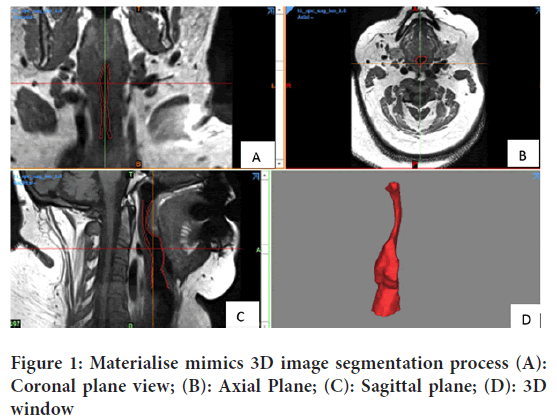
Figure 1: Materialise mimics 3D image segmentation process (A): Coronal plane view; (B): Axial Plane; (C): Sagittal plane; (D): 3D window
Digital Imaging and Communications in Medicine (DICOM) files were converted into Initial Graphics Exchange Specification (IGES) format to prepare MRI images for UA construction. The Mimics software was used to track the UA region. After the study file was imported, the UA was selected and converted to a Mimics project file containing all images. Once the alignment of the images was confirmed, three flat views were obtained.
Figure 1shows the coronal plane view (A), axial plane (B), sagittal plane (C), and 3D window (D) where each 3D model can be displayed. Pre-de- fined MRI scans were selected to set the threshold at which the required area was highlighted. By activating the 3D preview, the segmented model could be clearly verified.
The target area which included the nasopharynx, oropharynx and hy- popharynx parts was selected, cut, and then constructed as a 3D model from the top three views. It was then flattened to create smooth edges and the UA model was converted to Stereolithography (STL) format and ex- ported to the Meshmixer software, which was used to modify the bulky UA into a hollow enclosure. With the “Hollow” command, the model was marked with a shell thickness of 1 mm (How SC, 2010). The newly creat- ed STL file was imported as a Solid Body into Solid Works Software and exported into IGES format to be examined using ANSYS Fluent Software.
Bi-directional Fluid-Structure Interaction (FSI)
Airflow was a combination of the breath cycle with CPAP or CPAP and SIPO pressure, all of which were set to the CFX fluid setting. Solver Com- putational Fluid Dynamics (CFD) can solve the deformations of the UA wall when the interaction (coupling) between the UA hyperelastic wall and the airflow is established. Bi directional Fluid-Structure Interaction (FSI) was used to create the breakdown of the UA (respiratory arrest) and in- crease the narrowing of the UA to test the effectiveness of the airflow under the three scenarios. Apnea was defined as an airflow reduction of 90% and hypopnoea as an airflow reduction of 30% (Prabhu SS, et al., 2020). A 10% reduction in the airway radius (upper third of the hypopharynx) results in a 35% decrease in airflow in the UA anatomical regions (Ayalew MP, et al., 2021), which can lead to apnea syndrome (Osman AM, et al., 2018; Moxness MHS, et al., 2018).
For the UA tissue, a hyperelastic material was selected on the ANSYS Workbench (How SC, 2010) with E=18 kPa. Poisson’s ratio in the range 0.45 0.49 (Pérez MG, et al., 2016) was implemented and did not show any significant difference in the results. The temperature range was set to 37°C-38°C to simulate the reported air temperature in the lungs, and the density was set to 1000 kg/m3 (Li Y, et al., 2018). The instantaneous shear modulus was set to 10480 Pa. CFD/CFX simulations were performed to determine the viscoelastic behaviour of the tissue.
For the SIPO condition, a mean titration pressure of 70% was used to mimic that used in a previous clinical trial (Sanders I, et al., 2013). The normal CPAP titration pressure was in the range of 4-20 Cm H2O; thus, the reduced pressure was in the range of 4-14 Cm H2O. The IGES file of the UA model was loaded into the geometric design module. The geometry was created such that the UA was assumed to be an enclosure with a 1 mm wall thickness filled with air.
Meshing is an important ANSYS function that differs between airspace and tissue. Airway models were solved using the Fluid-Flow (CFX) Model- ler on the ANSYS Workbench diffusion (smoothing) method with a linear elastic solid and spring/boundary layer/Laplace (Li Y, et al., 2018) because of its tendency to produce better mesh quality. Simulations were repeated for different SIPO frequencies and amplitudes (Sanders I, et al., 2013). The complete breath cycle takes 4 s, with 2 s for a single inhalation and 2 s for a single exhalation. However, an automatic meshing method is used in the static structural analysis to avoid discrepancies in the resulting meshing. To examine ANSYS meshing efficiency, a skewness 0.5-1 indicates bad cell quality and 0-0.5 is good to excellent. This model yielded a skewness of less than 0.2 indicating excellent mesh quality (How SC, 2010). The number of nodes and elements were 15332 and 15358, respectively.
Fluid flow analysis
Simulations were performed to represent pharyngeal obstruction in OSA, CPAP therapy, or both CPAP and SIPO therapy.
Pharyngeal obstruction (Collapse-case)
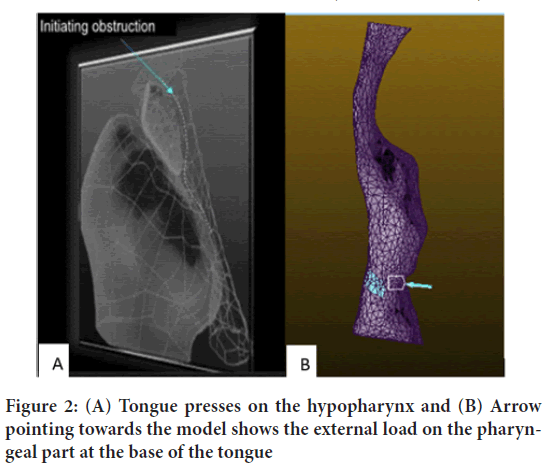
While conscious in the supine position, MRI showed that the patients could have UA narrowing, but no full UA obstruction was observed. To investigate OSA in these participants, pharyngeal obstruction/airflow re- duction was performed at the level of the tongue (How SC, 2010). The ex- ternal pressure strain originates from the posterior part of the decreased genioglossus, hyoglossus, and geniohyoid muscles (tongue base level) into the pharynx (Figure 2). A common tongue weight of approximately 60-70 grams with a cross-sectional region of the pharyngeal beginning of 700 mm2 was considered (Byron PR, 1989; Tsara V, et al., 2009). Thus, to set the pressure, it was observed that using an inward directional pressure of 2500-3000 Pa towards the hypopharynx resulted in airflow reduction. This was done to achieve a 90% airflow reduction (Liu KH, et al., 2007).
Figure 2: (A) Tongue presses on the hypopharynx and (B) Arrow pointing towards the model shows the external load on the pharyngeal part at the base of the tongue
ANSYS shows that the maximum deformation inside the UA wall rep- resents the inward/outward displacement distinction that is positioned among the unique geometry before and after applying the loading. There- fore, the following equation is proposed to measure the UA pharyngeal gap anterior/posterior assuming zero minimum obstruction, UA gap (mm)=Obstructive deformity mm-CPAP/SIPO (mm) deformity ……… (1)
Continuous Positive Airway Pressure (CPAP) application
Under CPAP, we used the same respiratory cycle (inspiration/expiration) and obstruction. The first step in this modelling process was to adjust the inlet/outlet pressure to maintain the 70% titration pressure used in the initial clinical trial (0.4-1.4 kPa). The air direction in the script is during the inhalation process, whereas the exhalation process assumes the oppos- ite direction. However, in the software, it was coded to make it resemble a breathing cycle with two breaths each time. As the CPAP introduces a pneumatic splint in the UA to help patients overcome apnoeic obstruc- tions, in the modelling process, we considered the inlet at the nasopharynx and the outlet at the trachea inlet. Deformation of the UA was observed using UA static analysis.Continuous Positive Airway Pressure (CPAP) with Super-Im- posed Pressure Oscillation (SIPO) application
CPAP with SIPO has been proposed as an improved treatment method that reduces titration pressure and UA dryness by stimulating salivary se- cretion (BaHammam AS, et al., 2014). This method achieved by super- imposing pressure oscillations on a CPAP device during the breathing cycle. Thus, the applied pressure P in KPa is assumed to be P=CPAP pressure+0.1 sin(wt) kPa.......... (2)
In the actual operation, the SIPO was adjusted to simulate clinical trials. 0.1 kPa in the equation represents an oscillating pressure of 1 cm H2O. Finally, pressure enters the UA from the nasopharynx while the CPAP is delivered.
Diagnostic parameters
This section summarises the diagnostic parameters for three scenarios: OSA obstruction, CPAP, and CPAP with SIPO. These parameters are UA HD, PWT, LPW and AHI. HD is determined by HD=(4 x target flow cross-sectional area )/(wetted perimeter of the same area)… (3)
To determine this, the UA geometry was cross-sectionally cut at the de- formed area and then exported to the Bluebeam software for HD calcula- tions. To check the HD values, the same cross section was measured using another software, DICOM 3D Image and Radiant, and the outcomes were in excellent agreement. Table 2 shows the calculated HD and size of the flow opening for obstructions under the three scenarios stated above.
Posterior Wall Thickness (PWT)
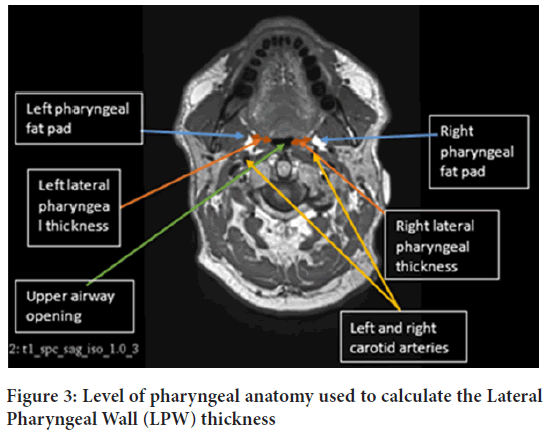
PWT in centimetres is the distance between the edge of the UA sidewall tract and the inner edge of the pharyngeal fat pad measured on both side of the pharynx. The average of the two gives LPW thickness which nor- mally can be measured by (i) The lateral distance between the pharyngeal fat pad and the edge of the UA wall on either side of the neck, or (ii) The distance between the carotid artery and the edges of the UA walls on both sides (Figure 3). A low PWT value implies that the UA is wide enough to allow more air to enter the lungs, which leads to a healthy sleep pattern. In general, the pharynx of men is found to be thicker than those of women, and hence less air is allowed into the lungs. This agrees with the statistics showing OSA prevalence is more in men than women.
Figure 3: Level of pharyngeal anatomy used to calculate the Lateral Pharyngeal Wall (LPW) thickness
AHI is normally used to measure the severity of OSA. A previous study has indicated that LPW thickness is the most important factor predicting the severity of OSA and that AHI is directly proportional to LPW. In that study 76 participants received polysomnography during sleep to meas- ure their AHI. All participants received ultrasound distance measure- ments and Polysomnography (PSG), and MRI data were collected for 15 of them. A good correlation was found between the ultrasound and MRI measurements of the pharynx. In our study, Bluebeam Revu × 64 extreme software version 12.0 was used to measure the throat thickness of the 10 participants. According to the increase and decrease of HD obtained from ANSYS simulations, the obstructions under OSA, CPAP and both CPAP with SIPO measurements were determined from the participants’ pharynx thickness.
Results and Discussion
Hydraulic Diameter (HD) and Lateral Pharyngeal Wall (LPW)
Table 2 shows the HD of the 10 patients tested in this study. The percent- age of opening under OSA ranged from 9.3%-11.3%, under CPAP 14.6%- 41%, and CPAP with SIPO 22.7%-64.8%. This indicates that a significant improvement occurred with the SIPO.
| Pt. ID | HD awake | HD obstruction | Obstruction opening percentage % | HD CPAP | CPAP opening percentage % | HD SIPO | SIPO opening percentage % |
|---|---|---|---|---|---|---|---|
| 1 | 38.8 | 4.2 | 10.80% | 8.996 | 23.20% | 9.336 | 24.10% |
| 2 | 40.5 | 4.6 | 11.30% | 8.95 | 22.10% | 10.5 | 25.90% |
| 3 | 46.5 | 5 | 10.90% | 8.845 | 19.00% | 18.61 | 40.00% |
| 4 | 49 | 5.5 | 11.20% | 7.13 | 14.60% | 11.1 | 22.70% |
| 5 | 18.1 | 1.945 | 10.70% | 5.411 | 29.90% | 11.5 | 63.50% |
| 6 | 28.6 | 2.67 | 9.30% | 5.8 | 20.30% | 7.8 | 27.30% |
| 7 | 29.5 | 3.3 | 11.20% | 12.1 | 41.00% | 24.5 | 83.10% |
| 8 | 23 | 2.4 | 10.40% | 7 | 30.40% | 14.9 | 64.80% |
| 9 | 27.6 | 2.9 | 10.50% | 5.8 | 21.00% | 11.2 | 40.60% |
| 10 | 28 | 3 | 10.70% | 5.1 | 18.20% | 11.5 | 41.10% |
Table 2: Hydraulic Diameter (HD) under awake, Obstruction, CPAP and CPAP with SIPO
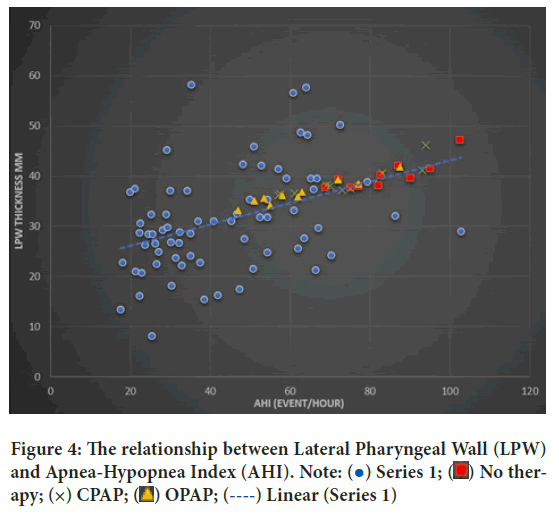
LPW thickness was measured for 10 OSA participants, and the results were added to the 76 participants and are presented in Figure 4.
Figure 4: The relationship between Lateral Pharyngeal Wall (LPW) and Apnea-Hypopnea Index (AHI). Note:  Series 1;
  No therapy; (×) CPAP;
  OPAP;
OPAP;  Linear (Series 1)
There was a direct correlation between ultrasound and MRI LPW thick- ness (r=0.78, P=0.001). The LPW thickness had high repeatability, and the correlation coefficients were within the range of 0.90-0.97 for the reliability of the inside and between the operators. There were 58 participants with significantly elevated OSA (AHI ≥ 10/h) who had a high Body Mass Index (BMI), larger neck circumference, and high LPW. The thickness measured using ultrasound was greater than ours (n=18), and the hourly AHI was less than 10. In univariate analysis, LPW thickness was positively correlat- ed with AHI (r=0.37, P=0.001). In the multivariate analysis, after adjusting for age, sex, neck circumference, and BMI, LPW thickness was positive- ly correlated and independent of AHI. The positive correlation between LPW thickness and AHI was only valid for men in univariate and multivariate analyses (n=62).
Significance of air pressure on Upper Airway (UA) walls
Two-way FSI was applied to 10 UA geometric shapes and simulations were conducted to investigate the effect of air pressure on the hyper-elastic UA tract. Figure 5 shows the effect of air pressure loading during the respir- ation cycle under the three conditions. The results of the finite element analysis are displayed through colour coding: Red indicates the point of maximum deformation, blue indicates the point of minimum compres- sive load, and green represents the effect of the average force on the wall. The minimum deformation level of all geometric shapes is ~0 (position), far from the applied pressure after the load is distributed, where there is almost no force. Each model was viewed from front, side, and back. The internal deformations in contact with the front wall of the neck are shown in the figures.
Figure 5: 3D view of Upper Airway (UA) modelling
In three scenarios (subjects 1, 3, 4, 8, and 9), the largest deformities were concentrated in the posterior hypopharyngeal wall. However, the largest deformations in models 2, 5, and 6 occurred on the anterior pharynx wall. Lateral deformations were also observed in Models 6, 7, and 9. Anterior deformity is related to pressure therapy to expand the tongue and UA of the uvula. Similar to actual clinical trials, the AHI score at this location was higher. Lateral deformity represents the fact that the treatment puts pres- sure on the lateral pharyngeal muscles (i.e. upper and lower pharyngeal muscles, throat, and underneath the tongue), and a patient can effective- ly fall asleep without lying on the back; subsequent deformities cause the treatment to affect the pharynx muscles, which start at the front of the neck and end at the back of the neck.
Table 3 lists the maximum deformations for the three scenarios considered in this study at various times during the breathing cycle. The percentage change in HD in the three cases (Table 2) was subtracted from the max- imum deformation of the obstacle (representing the lower value of the maximum deformation) to obtain the accessible air opening value. Sub- tract the value obtained from the LPW thickness in the case of obstruction and then change each value into a case divided by two to obtain the average thickness of the pharynx. The procedure is expressed as follows:
| Patient | 1st sec | 2nd sec | 3rd sec | 4th sec | ||||||||
|---|---|---|---|---|---|---|---|---|---|---|---|---|
| Obst | CPAP | SIPO | Obst | CPAP | SIPO | Obst | CPAP | SIPO | Obst | CPAP | SIPO | |
| 1 | 3.3 | 1.7 | 0.21 | 3.21 | 1.86 | 0.91 | 3.02 | 2.95 | 2.34 | 3.2 | 2.31 | 1.43 |
| 2 | 4.71 | 2.03 | 0.11 | 4.67 | 3.03 | 1.26 | 3.71 | 3.04 | 1.28 | 3.71 | 3.03 | 0.28 |
| 3 | 4.16 | 4.76 | 0.91 | 5.6 | 4.5 | 0.12 | 4.16 | 4.51 | 1.13 | 4.16 | 4.55 | 1.46 |
| 4 | 3.15 | 1.68 | 0.42 | 1.27 | 1.75 | 0.99 | 1.25 | 1.76 | 1.1 | 1.39 | 1.83 | 1.21 |
| 5 | 1.74 | 2.96 | 0.51 | 1.5 | 2.45 | 0.69 | 2.37 | 2.44 | 0.39 | 3.54 | 2.33 | 0.33 |
| 6 | 2.32 | 0.99 | 0.17 | 1.26 | 0.93 | 0.67 | 1.21 | 1.02 | 0.76 | 1.22 | 1.07 | 0.76 |
| 7 | 1.97 | 2.77 | 0.33 | 1.98 | 1.96 | 0.19 | 3.98 | 1.78 | 0.18 | 2.45 | 1.92 | 0.65 |
| 8 | 0.6 | 0.2 | 0.23 | 1.11 | 0.58 | 0.76 | 1.51 | 1.51 | 1.12 | 3.11 | 2.7 | 0.11 |
| 9 | 4.02 | 3.91 | 0.7 | 4.8 | 3.82 | 0.8 | 3.78 | 3.82 | 0.85 | 3.87 | 3.83 | 0.9 |
| 10 | 2.58 | 1.57 | 0.32 | 3.52 | 1.49 | 0.19 | 1.46 | 0.48 | 0.21 | 0.48 | 0.54 | 0.57 |
| Mean ± SE | 2.86 ± 0.4 | 2.26 ± 0.43 | 0.39 ± 0.08 | 2.89 ± 0.54 | 2.24 ± 0.4 | 0.66 ± 0.12 | 2.64 ± 0.39 | 2.33 ± 0.4 | 0.94 ± 0.2 | 2.71 ± 0.4 | 2.41 ± 0.38 | 0.77 ± 0.15 |
Table 3: Maximum deformations (mm) at various times within the breath cycle-obstructed, CPAP and CPAP with SIPO
Obstructed LPW=Bilateral LPW+Obstructed maximum deformation ……………… (4)
Pharyngeal gap CPAP=Maximum obstruction-Minimum CPAP de- formation (5)
LPW CPAP=LPW obstruction-Pharyngeal opening CPAP ………………………… (6)
Pharyngeal opening SIPO=Maximum obstruction-Minimum deforma- tion (7)
LPW SIPO=LPW obstruction-pharyngeal opening SIPO% use of SIPO therapy (8)
The average expected AHI for the CPAP treatment decreased by 11.9%, whereas that for the SIPO treatment decreased by 24.7% (Figure 5).
Comparing the maximum deformations for the three scenarios, Table 3, it can be seen that the largest deformation in the participants occurred in the first two seconds (inhalation) with participant no. 3, 4, 6, 9, and 10. In the 3rd and 4th seconds, participants 5, 7, and 8 observed the largest de- formities. The maximum distortion of the obstruction was between 2 mm and 5.4 mm until the CPAP therapy was gradually reduced between 0.5 mm and 4.5 mm. During SIPO therapy, the distortion ranged from 0.11 to 1.12 mm.
To check the effectiveness of CPAP and SIPO treatments for obstruction in the first four seconds (Table 1), the historical time of UA malformation was considered. The mean ± SE of 1st second in the obstruction condition was 2.86 ± 0.40, while the obstruction was reduced to 2.26 ± 0.43. The number of SIPO cases also continued to drop to 0.39 ± 0.08. Among these three cases, the deformation in the first second is the largest.
In the 2nd second of obstruction, the mean SE was 2.89 ± 0.54, while CPAP decreased to 2.24 ± 0.4 and 0.66 ± 0.12 SIPO. The decline in SIPO was different from that in the first second. The average ± standard errors of the 3rd second of the blocking sequence CPAP and SIPO are 2.64 ± 0.39, 2.33 ± 0.40, and 0.94 ± 0.20. During the 4th second, the mean ± standard error was 2.71 ± 0.40. The three consecutive obstruction cases, CPAP and SIPO were 2.41 ± 0.38, and 0.77 ± 0.15, respectively.
Compared with non-therapy cases, the thickness of the LPW was also re- duced after CPAP and SIPO. The number of untreated cases after CPAP decreased from 40.22 ± 0.92 to 38.81 ± 0.98, that is 3.50% reduction, while the reduction when applying SIPO was 8.87%. When using CPAP, the ex- pected AHI value decreased from 83.18 ± 3.35 to 73.25 ± 4.23, which is 11.938% reduction, while using SIPO, the expected AHI value decreased by 24.74%.
Comparing our results (n=10) with a previous actual sleep study (n=33) conducted according to the same modelling procedure of obstruction indicated that using CPAP with SIPO resulted in a 29.96% reduction in AHI, whereas using CPAP alone resulted in a 14.54% reduction. The sig- nificant difference between the expected AHI and actual AHI is due to the fact that the number of samples between the two groups is not equal; more UA samples need to be modelled. In the same sleeping position, each person’s simulated UA pressure load and the actual pressure load should be the same. To find the correct and more accurate measurement results, the LPW lateral measurement technique should be compared with the angle measurement method.
Conclusion
We discussed the estimation of HD, AHI, and LPW under OSA, CPAP, and CPAP with SIPO conditions using computer modelling based on demographic and MRI data collected from 10 patients with OSA. Simula- tions were conducted for the pharynx settings under these conditions. The main outcome of this study was that SIPO with CPAP showed significant improvement over CPAP treatment.
Declarations
Funding
We acknowledge Callaghan Innovation-New Zealand for supporting the student with fellowship number FAPX1603 during her course of study.
Ethical approval
It was successfully approved by the Auckland University of Technology Ethics committee.
Acknowledgement
This work was performed at the Institute of Biomedical Technologies (IBTec), Auckland University of Technology (AUT), Auckland, New Zea- land.
Data access statement
Research data supporting this publication are available upon request from the contacting author.
Author contributions
DA and AMA contributed to the design and implementation of the re- search, analysis of the results, and writing of the manuscript. SA contribut- ed to data collection and analysis.
References
- Lopes C, Esteves AM, Bittencourt LR, Tufik S, Mello MT. Relationship between the quality of life and the severity of obstructive sleep apnea syndrome. Braz J Med Biol Res. 2008; 41(10): 908-913.
[Crossref] [Google Scholar] [PubMed]
- Zamot N, Reyes A, Vazquez-Saad H, Ferrer G. Hemoptysis as the presenting sign of undiagnosed obstructive sleep apnea. SN Comprehen Clin Med. 2020; 2(3): 346-348.
- Abushab YA, Elshami HM, Albashir AE, Eesa MH. Endoscopic assisted coblation tongue base reduction in patients with obstructive sleep apnea. Egypt J Hospital Medicine. 2021; 82(4): 593-598.
- Daulatzai MA. Role of sensory stimulation in amelioration of obstructive sleep apnea. Sleep Disord. 2011; 2011.
[Crossref] [Google Scholar] [PubMed]
- Ashaat S. Understanding upper airway dynamic characteristics in OSA patients under invasive and non-invasive treatment. Auckland University of Technology. 2016.
- Dragonieri S, Porcelli F, Longobardi F, Carratù P, Aliani M, Ventura VA, et al. An electronic nose in the discrimination of obese patients with and without obstructive sleep apnoea. J Breath Res. 2015; 9(2): 26005.
[Crossref] [Google Scholar] [PubMed]
- AbdulRahman I, Yaqoob U, Bhatti TA. Sleep disorders caused by depression. Clin Depress. 2018; 4(2): 1-2.
- Xu H, Wang J, Yuan J, Hu F, Yang W, Guo C, et al. Implication of apnea‐hypopnea index, a measure of obstructive sleep apnea severity, for atrial fibrillation in patients with hypertrophic cardiomyopathy. J Am Heart Assoc. 2020; 9(8): e015013.
[Crossref] [Google Scholar] [PubMed]
- Roux F, D’Ambrosio C, Mohsenin V. Sleep-related breathing disorders and cardiovascular disease. The Am J Med. 2000; 108(5): 396-402.
[Crossref] [Google Scholar] [PubMed]
- Liu L, Kang R, Zhao S, Zhang T, Zhu W, Li E, et al. Sexual dysfunction in patients with obstructive sleep apnea: A systematic review and meta-analysis. J Sex Med. 2015; 12(10): 1992-2003.
[Crossref] [Google Scholar] [PubMed]
- Gami AS, Caples SM, Somers VK. Obesity and obstructive sleep apnea. Endocrinol Metab Clin North Am. 2003; 32(4): 869-894.
[Crossref] [Google Scholar] [PubMed]
- Ward K, Hoare KJ, Gott M. What is known about the experiences of using CPAP for OSA from the users' perspective? A systematic integrative literature review. Sleep Med Rev. 2014; 18(4): 357-366.
[Crossref] [Google Scholar] [PubMed]
- Qureshi A, Ballard RD, Nelson HS. Obstructive sleep apnea. J Allergy Clin Immunol. 2003; 112(4): 643-651.
[Crossref] [Google Scholar] [PubMed]
- Hui DS, Shang Q, Ko FW, Ng SS, Szeto CC, Ngai J, et al. A prospective cohort study of the long-term effects of CPAP on carotid artery intima-media thickness in obstructive sleep apnea syndrome. Respir Res. 2012; 13(1): 1-10.
[Crossref] [Google Scholar] [PubMed]
- Haba-Rubio J, Petitpierre NJ, Cornette F, Tobback N, Vat S, Giallourou T, et al. Oscillating positive airway pressure versus CPAP for the treatment of obstructive sleep apnea. Front Med. 2015; 2: 29.
[Crossref] [Google Scholar] [PubMed]
- BaHammam AS, Obeidat A, Barataman K, Bahammam SA, Olaish AH, Sharif MM. A comparison between the AASM 2012 and 2007 definitions for detecting hypopnea. Sleep Breath. 2014; 18(4): 767-773.
[Crossref] [Google Scholar] [PubMed]
- How SC. Effect of acute and chronic pressure-threshold inspiratory muscle training on upper and lower airway function. Brunel University School of Sport and Education PhD Theses. 2010.
- Prabhu SS, Kiell EP, David LR, Runyan CM. Obstructive sleep apnea secondary to pharyngeal narrowing from horizontal donor site closure during posterior pharyngeal flap surgery. Cleft Palate Craniofac J. 2020; 57(9): 1140-1145.
[Crossref] [Google Scholar] [PubMed]
- Ayalew MP, Nemomssa HD, Simegn GL. Sleep apnea syndrome detection and classification of severity level from ECG and SpO2 signals. Health Technol. 2021; 5: 1-12.
- Osman AM, Carter SG, Carberry JC, Eckert DJ. Obstructive sleep apnea: Current perspectives. Nat Sci Sleep. 2018; 10: 21-34.
[Crossref] [Google Scholar] [PubMed]
- Moxness MHS, Wülker F, Skallerud BH, Nordgård S. Simulation of the upper airways in patients with obstructive sleep apnea and nasal obstruction: A novel finite element method. Laryngoscope Investig Otolaryngol. 2018; 3(2): 82-93.
[Crossref] [Google Scholar] [PubMed]
- Pérez MG, Vakkilainen E, Hyppänen T. Fouling growth modeling of kraft recovery boiler fume ash deposits with dynamic meshes and a mechanistic sticking approach. Fuel. 2016; 185: 872-885.
- Li Y, Xu X, Zhou Y, Cai CS, Qin J. An interactive method for the analysis of the simulation of vehicle–bridge coupling vibration using ANSYS and SIMPACK. Proc Inst Mech Eng F J Rail Rapid Transit. 2018; 232(3): 663-679.
- Sanders I, Mu L, Amirali A, Su H, Sobotka S. The human tongue slows down to speak: Muscle fibers of the human tongue. Anat Rec. 2013; 296(10): 1615-1627.
[Crossref] [Google Scholar] [PubMed]
- Byron PR. Respiratory drug delivery. CRC Press. 1989.
[Crossref]
- Tsara V, Amfilochiou A, Papagrigorakis MJ, Georgopoulos D, Liolios E. Guidelines for diagnosis and treatment of sleep-related breathing disorders in adults and children. Definition and classification of sleep related breathing disorders in adults: Different types and indications for sleep studies (Part 1). Hippokratia. 2009; 13(3): 187-191.
[Google Scholar] [PubMed]
- Liu KH, Chu WC, To KW, Ko FW, Tong MW, Chan JW, et al. Sonographic measurement of lateral parapharyngeal wall thickness in patients with obstructive sleep apnea. Sleep. 2007; 30(11): 1503-1508.
[Crossref] [Google Scholar] [PubMed]
Author Info
Dalya Al-Mohamadamin1, Ahmed M Al-Jumaily1* and Sherif Ashaat22Institute of Applied Technology, Abu Dhabi, United Arab Emirates
Citation: Al-Mohamadamin D: Evaluation of Obstructive Sleep Apnea Diagnostic Parameters by Relatively Comparing Oscillations in CPAP Treatment
Received: 15-Feb-2023 Accepted: 10-Mar-2023 Published: 17-Mar-2023, DOI: 10.31858/0975-8453.14.3.177-182
Copyright: This is an open access article distributed under the terms of the Creative Commons Attribution License, which permits unrestricted use, distribution, and reproduction in any medium, provided the original work is properly cited.
ARTICLE TOOLS
- Dental Development between Assisted Reproductive Therapy (Art) and Natural Conceived Children: A Comparative Pilot Study Norzaiti Mohd Kenali, Naimah Hasanah Mohd Fathil, Norbasyirah Bohari, Ahmad Faisal Ismail, Roszaman Ramli SRP. 2020; 11(1): 01-06 » doi: 10.5530/srp.2020.1.01
- Psychometric properties of the World Health Organization Quality of life instrument, short form: Validity in the Vietnamese healthcare context Trung Quang Vo*, Bao Tran Thuy Tran, Ngan Thuy Nguyen, Tram ThiHuyen Nguyen, Thuy Phan Chung Tran SRP. 2020; 11(1): 14-22 » doi: 10.5530/srp.2019.1.3
- A Review of Pharmacoeconomics: the key to “Healthcare for All” Hasamnis AA, Patil SS, Shaik Imam, Narendiran K SRP. 2019; 10(1): s40-s42 » doi: 10.5530/srp.2019.1s.21
- Deuterium Depleted Water as an Adjuvant in Treatment of Cancer Anton Syroeshkin, Olga Levitskaya, Elena Uspenskaya, Tatiana Pleteneva, Daria Romaykina, Daria Ermakova SRP. 2019; 10(1): 112-117 » doi: 10.5530/srp.2019.1.19
- Dental Development between Assisted Reproductive Therapy (Art) and Natural Conceived Children: A Comparative Pilot Study Norzaiti Mohd Kenali, Naimah Hasanah Mohd Fathil, Norbasyirah Bohari, Ahmad Faisal Ismail, Roszaman Ramli SRP. 2020; 11(1): 01-06 » doi: 10.5530/srp.2020.1.01
- Manilkara zapota (L.) Royen Fruit Peel: A Phytochemical and Pharmacological Review Karle Pravin P, Dhawale Shashikant C SRP. 2019; 10(1): 11-14 » doi: 0.5530/srp.2019.1.2
- Pharmacognostic and Phytopharmacological Overview on Bombax ceiba Pankaj Haribhau Chaudhary, Mukund Ganeshrao Tawar SRP. 2019; 10(1): 20-25 » doi: 10.5530/srp.2019.1.4
- A Review of Pharmacoeconomics: the key to “Healthcare for All” Hasamnis AA, Patil SS, Shaik Imam, Narendiran K SRP. 2019; 10(1): s40-s42 » doi: 10.5530/srp.2019.1s.21
- A Prospective Review on Phyto-Pharmacological Aspects of Andrographis paniculata Govindraj Akilandeswari, Arumugam Vijaya Anand, Palanisamy Sampathkumar, Puthamohan Vinayaga Moorthi, Basavaraju Preethi SRP. 2019; 10(1): 15-19 » doi: 10.5530/srp.2019.1.3

