Research Article - (2021) Volume 12, Issue 12
Mini Fluid Challenge for Prediction of Fluid Responsiveness in Patients with Intra-Aortic Balloon Pump after Cardiac Surgery
Rostislav Enev*Abstract
Introduction: Patients with implanted Intra-Aortic Balloon Pump (IABP) after cardiac surgery present a unique challenge to intensivists in many terms including fluid management. One way to objectify fluid institution is to predict fluid responsiveness-whether cardiac output is to be increased after a fluid bolus-using a mini fluid challenge test. That elegant bedside test is simple and reduces fluid overload risk compared to classic fluid challenge.
Materials and methods: Patients with implanted IABP in the early period after open heart surgery were included in this study. A mini fluid challenge test was conducted. Cardiac output measurements were obtained before and after fluid bolus of 2 ml/kg body weight. Afterwards a fluid bolus of 4 ml/kg was administered and cardiac output was measured again.
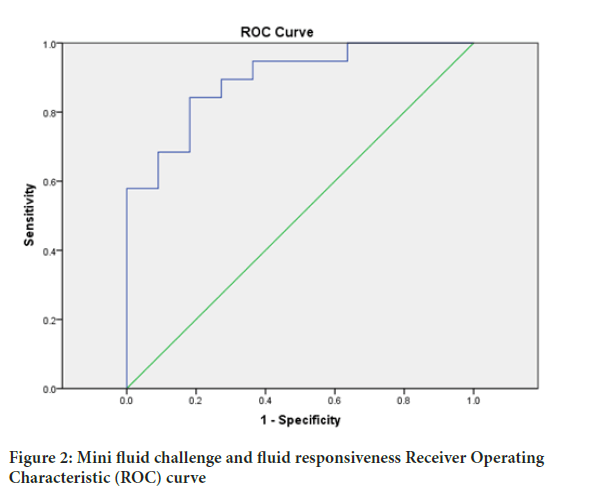
Results: Mini fluid challenge showed significant predictive value for fluid responsiveness with an area under the ROC curve of 89.5% (95% CI (Confidence Level) 78%-100%). Best cut off value was 7.7% change in cardiac output (sensitivity 84.2%, specificity 81.8%).
Conclusion: IABP patients may benefit from a mini fluid challenge as an efficient predictor of fluid therapy response.
Keywords
Mini fluid challenge, Intra-Aortic Balloon Pump (IABP), Fluid responsiveness, Cardiac surgery
Introduction
The presented study includes two core concepts-fluid responsiveness and intra-aortic counter-pulsation. Fluid responsiveness stands for the ability of the heart to increase its output by 10% or more in response to a fluid bolus (Marik PE, et al., 2009). Being fluid responsive means that the heart is functioning on the steep part of Frank-Starling curve but also that a fluid bolus is able to increase venous return to the heart by increasing mean circulatory filling pressure and stressed venous blood volume. The most straightforward way to test for fluid responsiveness is to institute fluid bolus (around 6 ml/kg) and evaluate the circulatory response-fluid challenge (Toscani L, et al., 2017). That approach turns out to be problematic in practice, because very often the test needs to be repeated several times during the day and that leads to fluid overload. For that reason the mini fluid challenge test was developed. It became evident that as little as 2 ml/kg or about 150 ml of fluid was enough to elicit a small increase of cardiac output (about 7%) in fluid responders (Muller L, et al., 2011). There is lack of scientific data regarding mini fluid challenge in the setting of IABP after cardiac surgery.
IABP is an invasive circulatory support device which increases diastolic aortic pressure and decreases cardiac afterload (Maccioli GA, et al., 1988). It is used to treat refractory cardiogenic shock. IABP is essentially a balloon tipped catheter placed in the descending aorta, with the balloon being inflated during diastole and deflated during systole. Patients with implanted IABP after open heart surgery differ significantly from other populations of critically ill patients. Not only have they been subjected to vast intravascular volume swings intraoperatively, but also they are presenting with a varying mixture of cardiogenic and distributive shock. These reasons justify a doubt in the usefulness of mini fluid challenge in that patient population. The aim of this study is to evaluate the predictive value of mini fluid challenge for fluid responsiveness in the setting of IABP after cardiac surgery.
Materials and Methods
Patients after cardiac surgery were enrolled in this study after hospital ethics commission approval was gained. An informed consent was obtained from all candidates in the preoperative period. Inclusion criteria were:
• Implanted IABP
• No Extracorporeal Membrane Oxygenation (ECMO)
• Evidence for Low Cardiac Output Syndrome (LCOS)
LCOS was defined as the presence of: cardiac index less than 2.2 L/ min/m2, lactate level more than 3 mmol/L, ScvO2 (central venous sample O2) below 50% or hypotension (Systolic Arterial Pressure (SAP) below 90 mmHg or Mean Arterial Pressure (MAP) below 60 mmHg) (Lomivorotov VV, et al., 2017).
Patients included in this study underwent open heart surgery-elective or emergent. A registered specialist in cardiac surgery was team leader in all cases. Anesthetic and operative techniques were standardized and no changes were made during the period of the study. Available equipment was not changed either. Cardiopulmonary bypass technique was also standardized.
IABP was implanted intraoperatively in the post bypass period when refractory cardiac failure was present and set at rate 1:1 after fluid loading and catecholamine index above 10. Catecholamine index=dopamine+dobutamine+adrenaline x 100+noradrenaline x 100 dose in μg/kg/min. Swan-Ganz catheter was inserted in all patients. Intensive Care Unit (ICU) admission followed surgery, patients were transported intubated and deeply sedated. Standard monitoring of vital signs was applied, including Heart Rate (HR), invasive arterial blood pressure, Central Venous Pressure (CVP), SpO2 (Oxygen Saturation), respiratory rate.
An initial measurement of cardiac output was done via the pulmonary artery catheter (CO1). A mini fluid challenge was then conducted using a 2 ml/kg bolus of Gelafusine over 5 minutes. Afterwards a second measurement of cardiac output was obtained (CO2), followed by another fluid bolus of 4 ml/kg over 10 minutes. A final measurement of CO was done eventually (CO3).
For safety reasons hemodynamic variables (Mean Arterial Pressure, Central Venous Pressure, Heart Rate) were closely monitored during fluid loading and testing was to be terminated if signs of hemodynamic decompensation occurred. No such event ensued in any patient.
Pulmonary artery catheter used was Edwards Life sciences five lumen Swan-Ganz catheter and pulmonary artery thermodilution was conducted according to available recommendations. For accuracy three separate measurements were made and a mean value was calculated. CO measurements were obtained after injection of 10 ml room temperature normal saline into the proximal catheter port. Visual evaluation of thermodilution curve reliability was made and erroneous measurements were excluded from recorded data.
For results analysis difference between CO1 and CO2 was calculated and labeled as Δ CO1, respectively difference between CO1 and CO3 as Δ CO2 .A positive response to maxi fluid challenge was defined as Δ CO2 of 10% or more. Patients who had positive response to maxi fluid challenge were identified as fluid responders.
Statistical analysis included the production of ROC via IBM SPSS 25 software. Predictive value of mini fluid challenge to fluid responsiveness was estimated using Area Under the Curve (AUC) evaluation. Cardiac output pre, mid and post fluid loading values were analyzed using Student’s paired t-test. Best cut-off value of Δ CO1 was determined as the highest additive value of sensitivity and specificity.
Results
After application of the inclusion criteria 30 patients were selected for this study. Data was collected for the period August 2018-August 2019. Patients American Society of Anesthesiology (ASA) class was III or IV.
Male to female ratio was 1.5. Mean age was 67.9 (+/-8.3). Mean Body Mass Index (BMI) was 27.9 (+/-4.9). 70% of patients had impaired left ventricle kinetics preoperatively. 40% of patients had hypertrophied left ventricle.
Type of surgery was combined operation in 40% of cases, revascularisation in 40% of cases, valve surgery in 16.7% and pulmonary artery thrombectomy in 3.3% of cases. Operation duration was 308 min (+/-47), cardiopulmonary bypass time was 115 min (+/-36) and aortic cross clamp was 57 min (+/-23). Catecholamine index after bypass was 16.3 (+/-14).
Hemodynamic measurements in ICU showed Heart Rate (HR) 96.2 (+/- 9.9), Systolic Arterial Pressure (SAP) 106.8 mmHg (+/-12.4), Mean Arterial Pressure (MAP) 78.3 mmHg (+/-11.8), Mean Pulse Pressure (MPP) 70.5 mmHg (+/-12.3), Central Venous Pressure (CVP) 7.9 mmHg (+/- 3.9), Pulmonary Capillary Wedge Pressure (PCWP) 13.0 mmHg (+/-4.5), Pulse-Amplitude Modulation (PAM) 22.6 mmHg (+/-7.6).
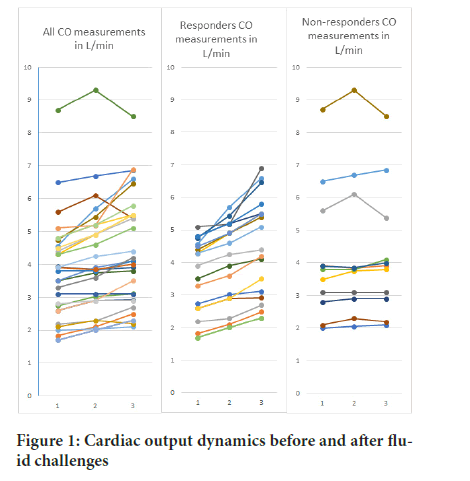
For statistical analysis purposes responders were labeled as “0” and non-responders as “1”. After maxi fluid challenge 19 patients (63%) were identified as fluid responders and 11 (37%) as non-responders. Mean CO1 was 3.78 (+/-1.54) L/min, mean CO2 was 4.09 (+/-1.69) L/min and mean CO3 was 4.37 (+/-1.68) L/min (Table 1).
| Patient no | CO1 (L/min) | CO2 (L/min) | CO3 (L/min) | ΔCO1% | ΔCO2% | Fluid responsive (0=yes, 1=no) |
|---|---|---|---|---|---|---|
| 1 | 4.56 | 5.7 | 6.6 | 25 | 44.74 | 0 |
| 2 | 1.83 | 2.1 | 2.5 | 14.75 | 36.61 | 0 |
| 3 | 2.19 | 2.29 | 2.7 | 9.59 | 23.29 | 0 |
| 4 | 4.3 | 4.9 | 5.5 | 13.95 | 27.91 | 0 |
| 5 | 6.5 | 6.69 | 6.85 | 2.92 | 5.38 | 1 |
| 6 | 2.74 | 3.02 | 3.11 | 10.22 | 13.5 | 0 |
| 7 | 3.92 | 3.84 | 3.91 | -2.04 | -0.26 | 1 |
| 8 | 5.6 | 6.1 | 5.4 | 1.79 | -3.57 | 1 |
| 9 | 1.7 | 2 | 2.3 | 17.65 | 35.29 | 0 |
| 10 | 4.75 | 5.45 | 6.46 | 14.74 | 36 | 0 |
| 11 | 2.6 | 2.9 | 2.92 | 11.54 | 12.31 | 0 |
| 12 | 3.5 | 3.75 | 3.8 | 7.14 | 8.57 | 1 |
| 13 | 2 | 2.05 | 2.1 | 2.5 | 5 | 1 |
| 14 | 5.1 | 5.18 | 6.9 | 19.61 | 35.29 | 0 |
| 15 | 4.4 | 4.9 | 5.4 | 11.36 | 22.73 | 0 |
| 16 | 4.8 | 5.2 | 5.5 | 8.33 | 14.58 | 0 |
| 17 | 3.5 | 3.9 | 4.1 | 11.43 | 17.14 | 0 |
| 18 | 4.3 | 4.6 | 5.1 | 6.98 | 18.6 | 0 |
| 19 | 3.8 | 3.8 | 4.1 | 0 | 7.89 | 1 |
| 20 | 3.9 | 3.85 | 4 | -1.28 | 2.56 | 1 |
| 21 | 3.3 | 3.6 | 4.2 | 9.09 | 27.27 | 0 |
| 22 | 2.1 | 2.3 | 2.2 | -4.76 | 4.76 | 1 |
| 23 | 3.1 | 3.1 | 3.1 | 0 | 0 | 1 |
| 24 | 8.7 | 9.3 | 8.5 | -4.6 | -2.3 | 1 |
| 25 | 3.9 | 4.25 | 4.4 | 5.13 | 12.82 | 0 |
| 26 | 2.6 | 2.9 | 3.5 | 11.54 | 34.62 | 0 |
| 27 | 2.8 | 2.9 | 2.9 | 3.57 | 3.57 | 1 |
| 28 | 4.5 | 4.9 | 5.5 | 8.89 | 22.22 | 0 |
| 29 | 1.7 | 2 | 2.3 | 17.65 | 35.29 | 0 |
| 30 | 4.8 | 5.2 | 5.8 | 8.33 | 20.83 | 0 |
Table 1: Cardiac output values and cardiac output change after mini and maxi fluid challenge
To test mini fluid challenge as a predictor of fluid responsiveness a Receiver Operating Characteristic (ROC) curve was generated using Δ CO1 percentage values and fluid responsiveness defined as Δ CO2 equal to or more than 10% (Figures 1 and 2). ROC Area Under the Curve (AUC) was 89.5% (95% CI (Confidence Level) 78%-100%), sig. 0.00038. Sensitivity was 84.2% and specificity 81.8%. Best cut off value of Δ CO1 was 7.7% with sensitivity 84% and specificity 82%.

Figure 1: Cardiac output dynamics before and after fluid challenges

Figure 2: Mini fluid challenge and fluid responsiveness Receiver Operating Characteristic (ROC) curve
Discussion
Our results point out that cardiac output change of 7.7% after mini fluid challenge with 2 ml/kg Gelafusine is a fairly good predictor of the hemodynamic response to 4 ml/kg fluid challenge. A typical bolus dose in common practice would be about 6 ml/kg. Thus a reasonable recommendation would be if one is aimed at fluid loading to start with a small bolus and to evaluate cardiac output and all other hemodynamic data available before continuing. Not surprisingly, this strategy was proposed many years ago in the dawn of fluid therapy. During one outbreak of cholera in 1832, Latta was the first to conclude intravenous infusion of fluid is able to improve dehydrated dying patients condition (Latta T, 1832). He experimented to put in small increments of water mixed with salt through a peripheral vein and observed the patient closely after each bolus. Initially no response was noted, but gradually after about 2.5 liters the patients got better and “were cured”. Empirical uninterrupted infusion of large amounts of fluid is unphysiological and easily leads to unnecessary complications in critically ill patients (Vincent JL, 2011).
The results of our study are comparable to other scientific data acquired in a similar fashion albeit in different patients populations. Biais et al. concluded, that mini fluid challenge is useful in the neurosurgery operating room, having ROC AUC 0.95 (95% CI (Confidence Level), 0.90 to 0.99) (Biais M, et al., 2017). According to a metaanalysis of Messina et al. mini fluid challenge has ROC AUC 0.91 (95% CI, 0.85-0.97) (Messina A, et al., 2019). Another group published ROC AUC of 0.93 (95% CI 0.80 to 0.97) and a cutoff value of 7% in spontaneously breathing patients under spinal anesthesia (Guinot PG, et al., 2015). In contrast Mallat et al. reported ROC AUC of 0.78 (95% CI: 0.68-0.88) (Mallat J, et al., 2015), however they used a 100 ml fluid bolus, which is about 1.4 ml/kg according to their patients mean weight. They also defined fluid responsiveness as a positive CO change of >15% after maxi fluid challenge.
This is the first study to address mini fluid challenge in patients with implanted IABP. It delivers important data regarding fluid responsiveness rate among these patients, estimated at 63% by our group. This study shows also, that a single 6 ml/kg fluid bolus can be given to the examined patient population in the early postoperative period without hemodynamic compromise. One needs also to bare in mind that the presented study has some important limitations. It is a small single center study, which could result in significant statistical bias.
Conclusion
Mini fluid challenge testing is an important opportunity not to be missed in the resuscitation of critically ill patients. It is a valid predictor of fluid responsiveness when coupled with pre and post cardiac output measurements. According to the presented results patients with implanted IABP device can be reliably identified as responsive or not responsive to fluid using a mini fluid challenge.
References
- Marik PE, Cavallazzi R, Vasu T, Hirani A. Dynamic changes in arterial waveform derived variables and fluid responsiveness in mechanically ventilated patients: A systematic review of the literature. Crit Care Med. 2009; 37(9): 2642-2647.
- Toscani L, Aya HD, Antonakaki D, Bastoni D, Watson X, Arulkumaran N, et al. What is the impact of the fluid challenge technique on diagnosis of fluid responsiveness? A systematic review and meta-analysis. Crit Care. 2017; 21(1): 1-2.
- Muller L, Toumi M, Bousquet PJ, Riu-Poulenc B, Louart G, Candela D, et al. An increase in aortic blood flow after an infusion of 100 ml colloid over 1 minute can predict fluid responsiveness: The mini-fluid challenge study. Anesthesiology. 2011; 115(3): 541-547.
- Maccioli GA, Lucas WJ, Norfleet EA. The Intra-Aortic Balloon Pump (IABP): A review. J Cardiothorac Anesth. 1988; 2(3): 365-373.
- Lomivorotov VV, Efremov SM, Kirov MY, Fominskiy EV, Karaskov AM. Low-cardiac-output syndrome after cardiac surgery. J Cardiothorac Vasc Anesth. 2017; 31(1): 291-308.
- Latta T. Relative to the treatment of cholera by the copious injection of aqueous and saline fluids into the veins. Lancet. 1832; 2: 274-277.
- Vincent JL. Let's give some fluid and see what happens” versus the “mini-fluid challenge. The Anesthesiology. 2011; 115(3): 455-456.
- Biais M, de Courson H, Lanchon R, Pereira B, Bardonneau G, Griton M, et al. Mini-fluid challenge of 100 ml of crystalloid predicts fluid responsiveness in the operating room. Anesthesiology. 2017; 127(3): 450-456.
- Messina A, Dell’Anna A, Baggiani M, Torrini F, Maresca GM, Bennett V, et al. Functional hemodynamic tests: A systematic review and a meta-analysis on the reliability of the end-expiratory occlusion test and of the mini-fluid challenge in predicting fluid responsiveness. Crit Care. 2019; 23(1): 1-6.
- Guinot PG, Bernard E, Defrancq F, Petiot S, Majoub Y, Dupont H, et al. Mini-fluid challenge predicts fluid responsiveness during spontaneous breathing under spinal anaesthesia: An observational study. Eur J Anaesthesiol. 2015; 32(9): 645-649.
- Mallat J, Meddour M, Durville E, Lemyze M, Pepy F, Temime J, et al. Decrease in pulse pressure and stroke volume variations after mini-fluid challenge accurately predicts fluid responsiveness. Br J Anaesth. 2015; 115(3): 449-456.
Author Info
Rostislav Enev*Received: 02-Jul-2021 Accepted: 16-Jul-2021 Published: 23-Jul-2021
Copyright: This is an open access article distributed under the terms of the Creative Commons Attribution License, which permits unrestricted use, distribution, and reproduction in any medium, provided the original work is properly cited.
ARTICLE TOOLS
- Dental Development between Assisted Reproductive Therapy (Art) and Natural Conceived Children: A Comparative Pilot Study Norzaiti Mohd Kenali, Naimah Hasanah Mohd Fathil, Norbasyirah Bohari, Ahmad Faisal Ismail, Roszaman Ramli SRP. 2020; 11(1): 01-06 » doi: 10.5530/srp.2020.1.01
- Psychometric properties of the World Health Organization Quality of life instrument, short form: Validity in the Vietnamese healthcare context Trung Quang Vo*, Bao Tran Thuy Tran, Ngan Thuy Nguyen, Tram ThiHuyen Nguyen, Thuy Phan Chung Tran SRP. 2020; 11(1): 14-22 » doi: 10.5530/srp.2019.1.3
- A Review of Pharmacoeconomics: the key to “Healthcare for All” Hasamnis AA, Patil SS, Shaik Imam, Narendiran K SRP. 2019; 10(1): s40-s42 » doi: 10.5530/srp.2019.1s.21
- Deuterium Depleted Water as an Adjuvant in Treatment of Cancer Anton Syroeshkin, Olga Levitskaya, Elena Uspenskaya, Tatiana Pleteneva, Daria Romaykina, Daria Ermakova SRP. 2019; 10(1): 112-117 » doi: 10.5530/srp.2019.1.19
- Dental Development between Assisted Reproductive Therapy (Art) and Natural Conceived Children: A Comparative Pilot Study Norzaiti Mohd Kenali, Naimah Hasanah Mohd Fathil, Norbasyirah Bohari, Ahmad Faisal Ismail, Roszaman Ramli SRP. 2020; 11(1): 01-06 » doi: 10.5530/srp.2020.1.01
- Manilkara zapota (L.) Royen Fruit Peel: A Phytochemical and Pharmacological Review Karle Pravin P, Dhawale Shashikant C SRP. 2019; 10(1): 11-14 » doi: 0.5530/srp.2019.1.2
- Pharmacognostic and Phytopharmacological Overview on Bombax ceiba Pankaj Haribhau Chaudhary, Mukund Ganeshrao Tawar SRP. 2019; 10(1): 20-25 » doi: 10.5530/srp.2019.1.4
- A Review of Pharmacoeconomics: the key to “Healthcare for All” Hasamnis AA, Patil SS, Shaik Imam, Narendiran K SRP. 2019; 10(1): s40-s42 » doi: 10.5530/srp.2019.1s.21
- A Prospective Review on Phyto-Pharmacological Aspects of Andrographis paniculata Govindraj Akilandeswari, Arumugam Vijaya Anand, Palanisamy Sampathkumar, Puthamohan Vinayaga Moorthi, Basavaraju Preethi SRP. 2019; 10(1): 15-19 » doi: 10.5530/srp.2019.1.3


