Research Article - (2021) Volume 12, Issue 12
Abstract
Background: Diffusion Weighted (DW) MRI, which was used to quantify the diffusional motion of water with the Apparent Diffusion Coefficient (ADC), has also been employed for diagnosing head and neck lesions. Previous studies reported that ADCs were useful in discrimination not only between benign and malignant tumors. We conducted the present study to assess the value of adding Diffusion-Weighted Magnetic Resonance Imaging (DW-MRI) and calculated Apparent Diffusion Coefficient (ADC) values in characterization of sinonasal lesions regarding differentiating benign from the malignant lesions.
Patients and methods: The present prospective study was conducted on 75 patients (with a mean age of 26.40 ± 25.2 year old; the majority of patients were females (58.7%)) who presented with sinonasal masses to the National Cancer Institute in Cairo during the period from June 2018 to June 2019. The following data were collected from eligible patients demographic characteristics, history related to sinonasal masses, conventional MRI characteristics of sinonasal masses, DW-MRI findings, and pathological diagnosis.
Results: Overall 52% of the patients had malignant masses. By Contrast-Enhanced MRI alone, 49 malignant- looking lesions were detected; after pathological analysis, only 33 proved to be truly positive for malignancy. Thus, using Contrast-Enhanced MRI in predicting benign and malignant lesions has the sensitivity of 84.6% and specificity of 55.6% with 67.3% positive predictive value and 76.9% negative predicative value. The calculated ADC value of the lesion was found to be statically significant different between the benign and malignant lesions. The malignant lesions had significantly lower ADC value. The ADC value of 0.99 × 10⁻³mm2/sec was suggested as the optimal cut-off between benign and malignant entities, with 92.3% sensitivity and 77.8% specificity.
Conclusion: DW-MRI and ADC values improves the diagnostic accuracy of imaging modalities in differentiation between the benign and malignant sinonasal masses.
Keywords
Sinonasal masses, Contrast-enhanced MRI, Diffusion-weighted MRI
Introduction
The sinonasal area is affected by a wide spectrum of benign and malignant tumors and tumor like lesions. It is essential to distinguish benign from malignant sinonasal tumors for treatment planning as well as determining the patient’s prognosis. However, the presenting symptoms of benign and malignant sinonasal tumors, such as nasal discharge, epistaxis and nasal obstruction are often nonspecific. Moreover, although endoscopic excisional biopsy in the sinonasal area is performed easily and used widely, the diagnostic sensitivity is low due to the fact that surrounding inflammatory tissues may be obtained. Therefore, the effective differentiation between benign and malignant sinonasal tumors is often difficult in the clinical practice (Wang XY, et al., 2015).
The malignant sinonasal tumors, a variety of histological types mainly including squamous cell carcinoma, Adenoid Cystic Carcinoma and lymphomas, can invade into the critical structures of the anterior and central skull base and threaten one’s life. However, despite imaging developments, effective diagnosis of sinonasal lesions only on the basis of conventional Computed Tomography (CT) and Magnetic Resonance Imaging (MRI) is still difficult (Sakamoto J, et al., 2014).
Conventional Computed Tomography (CT) and Magnetic Resonance Imaging (MRI) play essential roles in the diagnosis of sinonasal lesions Computed Tomography (CT) provides excellent details about the thin bony sinonasal walls, but is of limited value in characterization of soft tissue mass due to poor soft tissue contrast resolution. Magnetic Resonance Imaging (MRI) is widely accepted as the best technique for the characterization of an indeterminate mass due to the excellent soft tissue resolution, and many MRI features contribute a lot to the diagnosis of sinonasal tumors (Gomaa MA, et al., 2013).
Nevertheless, these MRI features are often nonspecific. For example, convoluted cerebriform pattern is a reliable MRI feature of sinonasal inverted papillomas, but it is also demonstrated in a proportion of malignant tumors. Therefore, the discrimination between benign and malignant tumors on the basis of conventional CT and MRI findings is still difficult in a substantial number of cases and new imaging method is required to improve the discrimination (Mohaghegh P and Rockall AG, 2012).
Diffusion Weighted (DW) MRI, which was used to quantify the diffusional motion of water with the Apparent Diffusion Coefficient (ADC), has also been employed for diagnosing head and neck lesions. Previous studies reported that ADCs were useful in discrimination not only between benign and malignant tumors but also between benign and metastatic lymph nodes in the head and neck region (Wan Q, et al., 2019).
For sinonasal tumors, a previous study showed effective differentiation between benign and malignant sinonasal lesions (93% accuracy) was achieved by measuring the ADCs. Nevertheless, inflammatory polyps that showed extremely high ADCs were also included in the benign tumor group. Another study showed ADC mapping based on a pixelbypixel analysis of the whole tumor volume facilitated the differentiation between benign/inflammatory lesions and malignant tumors in the sinonasal area (Sasaki M, et al., 2011).
Overall Apparent Diffusion Coefficient (ADC) of malignant tumors were significantly smaller than those of benign and inflammatory lesions. There was no significant difference in overall ADCs between benign and inflam matory lesions. An ADC cutoff point of 0.84 × 103 mm²/s was best for differentiating benign/inflammatory lesions from malignant tumors; it provided diagnostic ability of 61% sensitivity, 94% specificity, 79% accuracy, and 90% positive and 74% negative predictive values (Abdel Razek AA and Nada N, 2013; Elsherbini AA, et al., 2011).
ADC and ADC mapping demonstrated that lymphomas had the lowest overall ADCs and the greatest percentages of total tumor areas with extremely low and/or low ADCs among the malignant tumors. Overall ADCs of SCCs (including Spindle Cell Carcinoma and non‑keratinizing SCCs) and of undifferentiated carcinomas were significantly greater than those of the lymphomas and the percentages of total tumor area with extremely low and/or low ADCs of these malignant tumors were significantly smaller than those of the lymphomas. However, the overall ADC parameters of the SCCs and undifferentiated carcinomas were significantly smaller than those of the other malignancies and the percentages of total tumor area with extremely low or low ADCs were greater than those of the other malignancies (Law BK, et al., 2018).
Fungus infections and organized hematomas had significantly smaller overall ADC values and greater percentages of total tumor areas with extremely low or low ADCs among the inflammatory and benign lesions. On the other hand, fungus infections and hematomas had significantly greater overall ADCs and smaller percentages of total tumor areas with extremely low or low ADCs than the malignant lymphomas, SCCs, and undifferentiated carcinomas (Koehli M, et al., 2011).
The purpose of this study is to determine whether the combination of Diffusion‑Weighted (DW) and conventional Magnetic Resonance Imaging can improve the performance in characterization of sinonasal lesions.
Methods and Patients
Technique
Conventional CEMRI (Contrast-Enhanced Magnetic Resonance Im- aging): All the patients were evaluated by MRI paranasal sinuses with diffusion in National Cancer Institute, Cairo University using a 1.5 T scanner (Achieva, Philips Medical Systems, Best, Netherlands, Release 2.6, and Level 3).
The average total time of the scan was about 40 minutes.
All the cases were examined in supine position with standard circular polarized head coil using the following sequences:
• Scout T1 TFE (T1 Turbo Field Echo) (15/5.2 ms) TR/TE (Retention Time/Echo Time), flip angle 20̊, FOV (Field of View) 250 mm, matrix size 256 × 256, slice thickness 10 mm, gap 10 mm.
• Axial T2WI (T2 Weighted Image) spin echo (4126/100 ms) TR/TE, flip angle 90̊ FOV 225 mm, matrix size 256 × 256, slice thickness 5 mm, gap 2.5 mm for paranasal sinuses.
• Axial T1WI spin echo (406/15 ms) TR/TE, flip angle 70̊, FOV 179 mm, matrix size 256 × 256, slice thickness 5 mm, gap 2.5 mm for paranasal sinuses.
• Axial STIR (Short Tau Inversion Recovery) (3257/20 ms) TR/TE, flip angle 90̊, FOV 179 mm, matrix size 256 × 256, slice thickness 5 mm, gap 2.5 mm for paranasal sinuses.
• Coronal T1WI spin echo (447/15 ms) TR/TE, flip angle 69̊, FOV 184 mm, matrix size 256 × 256, slice thickness 5 mm, gap 2.5 mm.
• Coronal T2WI spin echo (4417/100 ms) TR/TE, flip angle 90̊, FOV 183 mm, matrix size 256 × 256, slice thickness 5 mm, gap 2.5 mm.
After intravenous administration of Gadolinium‑DTPA (Diethylenetriamine Diethylenetriamine Penta‑Acetic acid) (0.3 mg/kg), contrast enhanced T1WI in axial, sagittal and coronal planes are obtained.
• T1WI in axial (406/15 ms) TR/TE, flip angle 70̊, FOV 179 mm, matrix size 256 × 256, slice thickness 5 mm, gap 2.5 mm.
• T1WI in sagittal (515/514 ms) TR/TE, flip angle 69̊, FOV 190 mm, matrix size 256 × 256, slice thickness 5 mm, gap 2.5 mm.
• T1WI in coronal (447/15 ms) TR/TE, flip angle 69̊, FOV 184 mm, matrix size 256 × 256, slice thickness 5 mm, gap 2.5 mm.
The lesions were evaluated in MRI commenting on:
• Signal behaviour on T1 and T2 (iso, hypo and hyper intense relative to muscles)
• Presence of intratumoral hemorrhagic or necrotic components.
• Enhancement degree (no, minimal or avid) and pattern (homogenous or heterogenous).
Magnetic resonance diffusion imaging: Diffusion‑weighted MR imaging was obtained using a multi section single‑shot echo planar imaging sequence (TR/TE/NEX (Number of excitations): 2200/139 ms/1) field of view 195 mm, matrix size, 128‑128, section thickness 5 mm, section gap 2.5 mm with b values of 0 s/ mm2, 500 s/ mm2 and 1000 s/ mm2. The Signal Intensity of the lesion on DWI (b=1000) was classified as hypointense (free diffusion) or hyperintense (restricted diffusion).
The Apparent Diffusion Coefficient (ADC) maps were calculated automatically by the MRI software. Freehand regions of interest along the margins of the lesions were manually placed onto the ADC maps by using the corresponding FS (Fat Suppressed) T2‑weighted MR images as references for placing the regions of interest. Then, average ADCs were determined. The ADC values were expressed 10‑3 mm2/s.
Cystic and necrotic components were differentiated as areas of hyperintensity on T2‑weighted MR Images and on contrast‑enhanced T1‑weighted images as areas of non‑enhancement. Hemorrhagic lesions were differentiated on unenhanced T1‑weighted MR images as areas of hyper intensity and not suppressed on STIR images.
Histopathological analysis of the masses was done after the MR examination to correlate the histopathology with the DWI (Diffusion Weighted Imaging) results.
Statistical analysis: The statistical analysis of data was done by using Excel and the SPSS program (Statistical Package for Social Science version 20).
• The description of data was done in the form of mean and SD (Standard Deviation).
• The Kolmogorov‑Smirnov (K‑S) test was done for diagnosis normality of data distribution.
• The analysis of data was done to test statistical significant difference.
• The Student’s "t" test was used to compare between two groups. The Receiver Operating Curve (ROC) was done to determine the cutoff point with highest accuracy and sensitivity.
• The "p" value was considered significant if ≤ 0.05 at the 95% confidence interval.
Results
The demographics of patient’s data in this study included 75 patients (31 male and 44 female) patients. Patients ages ranged from 1‑73 year with a mean of 26.40 ± 25.202 (mean ± SD).
All these patients were subjects to conventional MRI and MR diffusion study as a part of their pre‑operative assessment.
The Locations of these lesions were distributed as follows; the maxillary antra and ethmoidal air cells were the seat of most of the lesions, the others located in the nasal cavity, sphenoidal, frontal sinuses and nasopharynx.
Patients were grouped according to final pathological diagnosis into 2 groups the benign group and the malignant group. The benign group included 36 patients while the malignant group included 39 patients. The diagnoses in the benign group as determined by pathological analysis were diverse: Brown tumor 4%, meningioma 6.7%, fungal sinusitis 12%, Fibrous Dysplasia (FD) 6.7%, mucocele 4% and others #. The diagnoses in the malignant group were not less diverse, if not more; they included: squamous cell carcinoma, adenocarcinoma 4%, Rhabdomyosarcoma (RMS) 13.3%, lymphoma 8%, leukemia 2.7%, Adenoid Cystic Carcinoma (ACC) 2.7% and others. Even rare cases were found such as myxoid mesenchymal tumor of infancy 1.3% and Primitive Neuro‑Ectodermal Tumor (PNET) 4%. However, the most common malignant lesion found in our study was: Rhabdomyosarcoma (RMS) representing 52% of all malignant lesions all these data presented in Table 1.
| Variable | Patients (N=75) |
|---|---|
| Age, mean ± SD | 26.4 ± 25.2 |
| Gender, No. (%) | Female 44 (58.7%), Male 31(41.3%) |
| Location, No. (%) | |
| Maxillary | 39 (52%) |
| Ethmoidal | 39 (52%) |
| Sphenoidal | 28 (37.3%) |
| Nose | 31 (41.3%) |
| Nasopharynx | 9 (12%) |
| Frontal | 6 (8%) |
| Pathological diagnosis, No. (%) | |
| Benign | 36 (48%) |
| Fungal sinusitis | 9 (12%) |
| Fibrous dysplasia | 5 (6.7%) |
| Meningioma | 5 (6.7%) |
| Others | 17 (22.7%) |
| Malignant | 39 (52%) |
| Rhabdomyosarcoma (RMS) | 10 (13.3%) |
| Lymphoma | 6 (8%) |
| Squamous cell carcinoma | 4 (5.3%) |
| Primitive Neuro-Ectodermal Tumor (PNET) | 3 (4%) |
| Adenocarcinoma | 3 (4%) |
| Others | 13 (17.3%) |
Table 1: The clinical and pathological characteristics of the included patients
Results of conventional MRI of the study group
On basis of Signal Intensity on T1WI and T2WI and contrast uptake, the Lesions were assessed primarily with conventional MRI alone. They were labelled as either benign‑looking “B” or malignant‑looking “M”, according to presence of criteria of malignancy; e.g. ill‑definition of margins or invasion of surroundings. Our results by conventional MRI alone showed 49 malignant‑looking lesions, after pathological analysis; only 33 proved to be truly positive for malignancy with 16 false positive cases. 26 lesions were detected as benign looking; only 20 proved to be truly negative for malignancy with 6 false negative ones (Table 2).
| Variable | Benign (N=36) | Malignant (N=39) |
|---|---|---|
| T1 signal criteria, No. (%) | ||
| High SI (Signal Intensity) | 6 (16.7%) | 1 (2.6%) |
| Intermediate | 14 (38.9%) | 29 (74.4%) |
| low SI | 9 (25%) | 6 (15.4%) |
| Mixed SI | 7 (19.4%) | 3 (7.6%) |
| T2 signal criteria, No. (%) | ||
| Intermediate | 7 (19.4%) | 12 (30.7%) |
| Low SI | 5 (13.9%) | 4 (10.3%) |
| Mixed SI | 18 (50%) | 15 (38.5%) |
| Enhancement, No. (%) | ||
| Homogenous | 9 (25%) | 10 (25.6%) |
| Heterogeneous | 18 (50%) | 29 (74.4%) |
| No uptake | 5 (13.9%) | 0 |
| Faint | 8 (22.2%) | 11 (28.2%) |
| Intense | 19 (52.8%) | 28 (71.8%) |
| Definition of margins, No. (%) | ||
| Ill | 18 (50%) | 29 (74.4%) |
| Well-defined | 18 (50%) | 10 (25.6%) |
| Shape and borders, No. (%) | ||
| Regular | 19 (52.8%) | 6 (15.4%) |
| Irregular | 17 (47.2%) | 33 (84.6%) |
| Relationship to surrounding structures, No. (%) | ||
| Not invading | 25 (69.4%) | 26 (66.7%) |
| Invading surroundings | 11 (30.6%) | 13 (33.3%) |
| Final diagnosis, No. (%) | ||
| Benign | 16 (44.4%) | 33 (84.6%) |
| Malignant | 20 (55.6%) | 6 (15.4%) |
Table 2: Conventional Magnetic Resonance Imaging (MRI) characteristics of the included patients
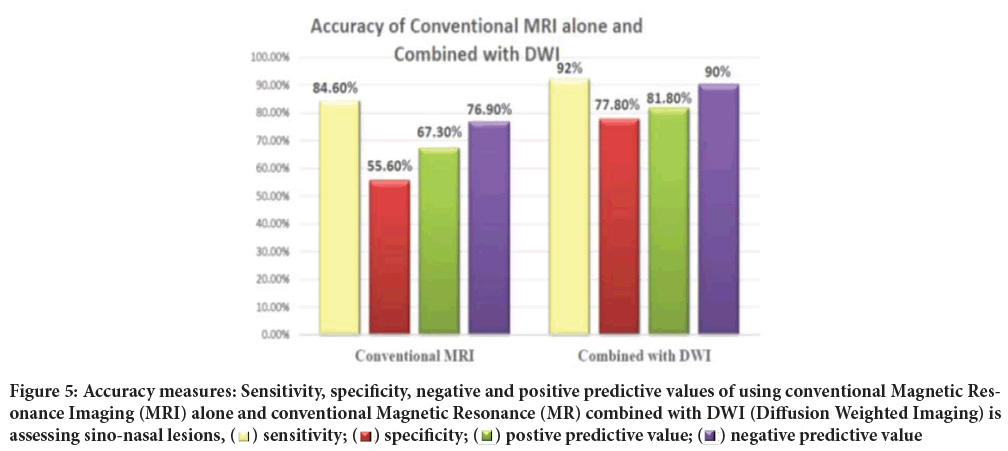
Thus, using conventional MRI alone in predicting benign and malignant lesions has the sensitivity of 84.6% and specificity of 55.6% with 67.3% positive predictive value and 76.9% negative predicative value.
Results of diffusion weighted imaging in the study group
The Apparent Diffusion Coefficient (ADC) values were calculated along the margins of all lesions using b value=1000. The calculated ADC values ranged from 0.34 to 2.5 × 10‑3 mm2/sec. the ADC values had a mean ± SD 0.95 ± 0.51, of all patients.
The calculated ADC value of the lesion was found statically significant in differentiation between the benign and malignant lesions (Figure 1). The mean ADC value for benign lesions was 1.25 × 10‑3 mm2/sec ± 0.52, while the mean ADC value for malignant lesions was 0.67 × 10‑3 mm2/sec ± 0.29 (P<0.001).
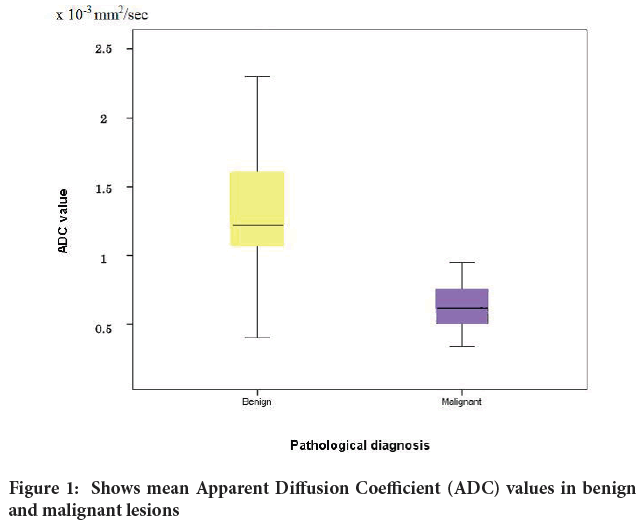
Figure 1: Shows mean Apparent Diffusion Coefficient (ADC) values in benign and malignant lesions
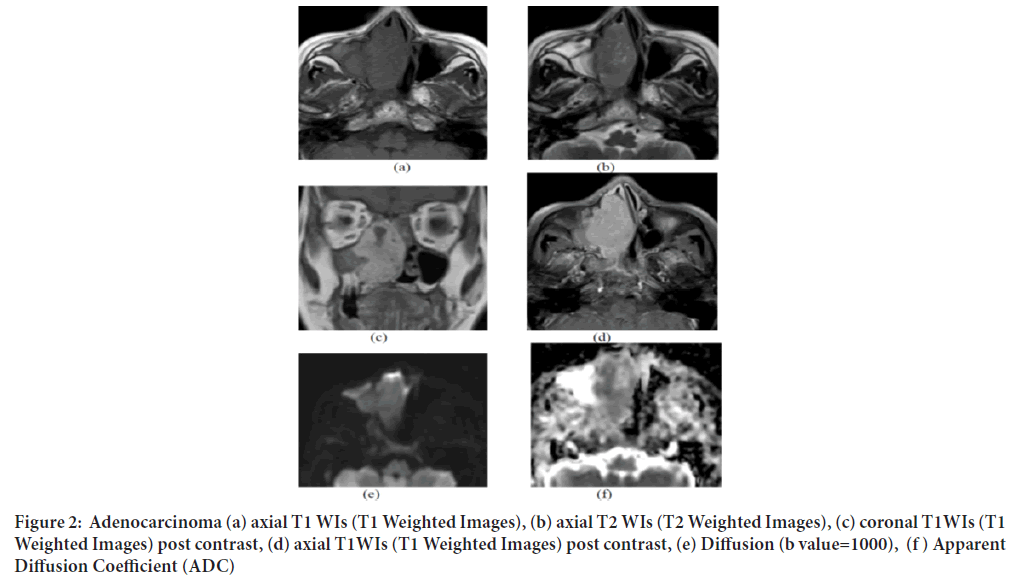
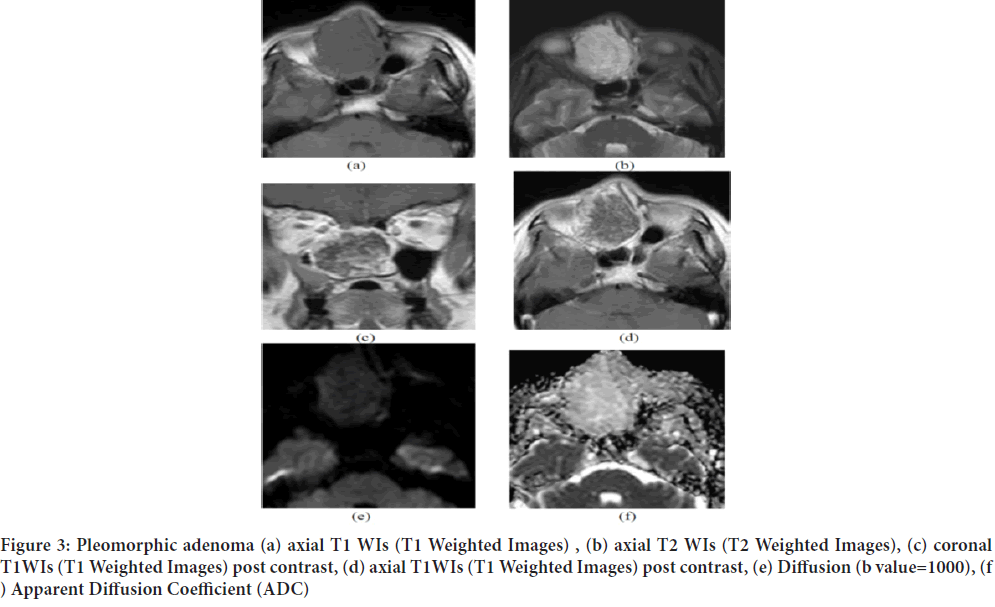
The diverse pathologies detected in this study makes comparison between different types in attempt to attribute suggestive ADC values to each type, quite difficult. However (Table 3) lists all pathological types (Figures 2 and 3)detected with their mean ADC values as well as their medians and ranges.
| N | Mean | SD | Median | Minimum | Maximum | ||
|---|---|---|---|---|---|---|---|
| Benign | Fungal sinusitis | 9 | 1.07 | 0.49 | 1.2 | 0.4 | 1.6 |
| Fibrous dysplasia | 5 | 0.66 | 0.3 | 0.59 | 0.47 | 1.2 | |
| Meningioma | 5 | 1.8 | 0.19 | 1.24 | 0.85 | 1.3 | |
| Malignant | RMS | 10 | 0.68 | 0.15 | 0.68 | 0.51 | 0.95 |
| Lymphoma | 6 | 0.38 | 0.26 | 0.4 | 0.34 | 0.4 | |
| SCC | 4 | 0.67 | 0.57 | 0.66 | 0.63 | 0.76 | |
Table 3: Mean Apparent Diffusion Coefficient (ADC) values in different benign and malignant pathologies
Figure 2: Adenocarcinoma (a) axial T1 WIs (T1 Weighted Images), (b) axial T2 WIs (T2 Weighted Images), (c) coronal T1WIs (T1 Weighted Images) post contrast, (d) axial T1WIs (T1 Weighted Images) post contrast, (e) Diffusion (b value=1000), (f ) Apparent Diffusion Coefficient (ADC)
One of our cases of a 69‑year old female patient presented with right nasal obstruction the conventional MRI showed a well‑defined expansile soft tissue mass is seen at the right nasal cavity extending to the right ethmoidal, sphenoidal sinuses, nasopharynx and encroaching upon the right maxillary antrum with no intra cranial extension eliciting iso‑intense signal on T1 (a) and T2 (b) with avid homogenous contrast enhancement (c and d). It shows restricted diffusion (e) and ADC (f) value of 0.87 × 10‑3 mm2/sec and pathologically proven to be adenocarcinoma (Figure 2).
Another case of a 52‑year old female patient presented with right nasal obstruction, the conventional MRI showed a lobulated expansile soft tissue mass lesion is seen implicating the right nasal cavity and right ethmoid air cells eliciting iso‑intense signal on T1 (a) high T2 signal (b) with avid heterogenous contrast enhancement (c and d). It shows facilitated diffusion (e) and ADC (f) value of 1.6 × 10‑3 mm2/sec and pathologically proven to be pleomorphic adenoma (Figure 3).
Figure 3: Pleomorphic adenoma (a) axial T1 WIs (T1 Weighted Images) , (b) axial T2 WIs (T2 Weighted Images), (c) coronal T1WIs (T1 Weighted Images) post contrast, (d) axial T1WIs (T1 Weighted Images) post contrast, (e) Diffusion (b value=1000), (f ) Apparent Diffusion Coefficient (ADC)
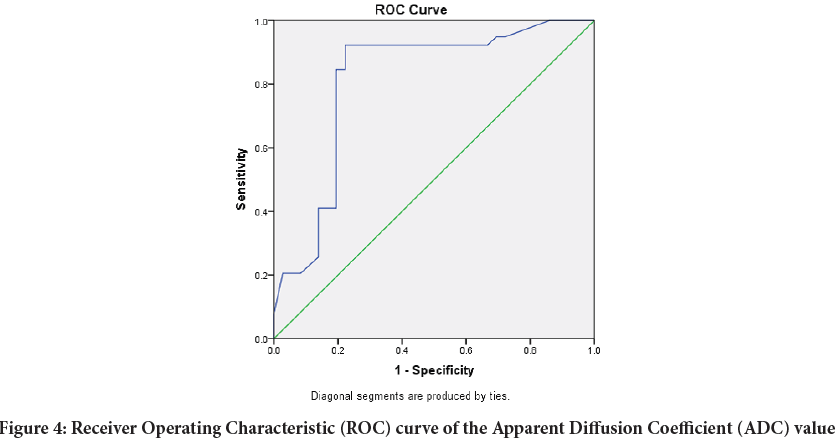
In order to determine optimum thresholds for discrimination between benign and malignant lesions based on ADC values Logistic regression and Receiver Operating Characteristic (ROC) curve analysis were performed and showed that a (ADC) value of 0.995 × 10‑3 mm2/sec was suggested as an optimal cut‑off between benign and malignant entities, with 92.3% sensitivity and 77.8% specificity, the area under the curve is 0.811 which indicates that the accuracy of the test is 81% (Figure 4).
Figure 4: Receiver Operating Characteristic (ROC) curve of the Apparent Diffusion Coefficient (ADC) value
Results of diffusion weighted imaging signal intensity
The Signal Intensity (SI) of the benign and malignant groups on Diffusion‑Weighted images was assessed visually into three levels of varying intensity (Table 4)significant difference (p<000.1) was found between the 84.7% of all malignant lesions exhibited that hyperintense and mixed intense SI in DWI, while 66.7% of the benign lesions showed hypointense and mixed intensities
| Benign | Malignant | |||
|---|---|---|---|---|
| Count | % | Count | % | |
| Hyperintense | 4 | 11.10% | 15 | 38.50% |
| Hypointense | 15 | 41.70% | 1 | 2.60% |
| Isointense | 8 | 22.20% | 5 | 12.70% |
| Mixed intensity | 9 | 25% | 18 | 46.20% |
Table 4: Diffusion Weighted Imaging (DWI) SI of benign and malignant sino-nasal lesions
The lesions were assessed again, this time combined with DWI considering the DWI signal and ADC value. After combination of DWI 44 malignant looking lesions were detected, 36 proved to be true malignant lesions and 8 false positive ones. As 31 benign looking ones were detected, 28 proved to be true benign lesions and 3 false positive ones (Figure 5). So, combining DWI and ADC values has increased accuracy, as the sensitivity and specificity were 92.3%, 77.8% respectively with 81.8% positive predictive value and 90.3% negative predicative value.
Figure 5: Accuracy measures: Sensitivity, specificity, negative and positive predictive values of using conventional Magnetic Resonance Imaging (MRI) alone and conventional Magnetic Resonance (MR) combined with DWI (Diffusion Weighted Imaging) is
assessing sino-nasal lesions,  sensitivity;
  specificity;
  postive predictive value;
  negative predictive value
Discussion
The nasal cavity and paranasal sinuses are affected by a wide spectrum of benign and malignant tumors and tumor like lesions. It is essential to distinguish benign from malignant sinonsal tumors for treatment planning as well as determining the patient’s prognosis. However, the presenting symptoms of benign and malignant sinonasal tumors, such as nasal discharge, epistaxis and nasal obstruction are often nonspecific (Razek AA, et al., 2009).
Even if imaging is performed in the early stages, a radiologist inexperienced with sinonasal anatomy and tumor features may easily interpret early signs of a malignant tumor as rhinosinusitis or a lesion that does not require follow‑up. Advanced unilateral opacification or bone destruction at imaging should always alert the radiologist (Eggesbø HB, 2012).
Computed Tomography (CT) scans help to reveal bony erosion in critical areas, and Magnetic Resonance Imaging (MRI) studies provide excellent delineation of sinonasal tumor from surrounding inflamed soft tissue and secretions, making both of these technologies useful for disease staging and surgical planning (Wippold FJ, 2007).
Computed Tomography (CT) and MR imaging features of sinonasal tumors and tumor like lesions have often been described as an expansile or infiltrative soft tissue mass with sinus wall erosion and destruction, heterogeneous Signal Intensity on T2‑weighted MR images, and irregular or homogeneous enhancement after contrast medium injection. However, the imaging features of benign and malignant sinonasal lesions are often nonspecific and overlap (Zou J, et al., 2014).
Diffusion‑Weighted Imaging (DWI) has been advocated in the literature as an MRI tool that can provide information about tissue cellularity and physiological processes. DWI qualitatively describes random water molecule movement, called Brownian motion, and it can analyze water diffusibility within the intercellular medium. The motion of water molecules varies qualitatively among distinct tissues and intercellular conditions, and, similarly, it may vary in different tissue conditions (Munhoz L, et al., 2018).
Hypercellular tissue, as occurring within malignant tumors, will show low ADC values. Non‑tumoral tissue changes such as edema, inflammation, fibrosis and necrosis are expected to show low cellularity, in strong contrast with viable tumor, this results in high ADC values. An inverse correlation between the ADC value and tumor cellularity in experimental models has been shown, and this was clinically validated (El Said NA, et al., 2014).
This study included 75 patients (31 male and 44 female). Thirty‑nine patients had malignant lesions and thirty‑six had benign ones. The DWI was obtained with b values including 0, 500 and 1000 mm2/second. The Apparent Diffusion Coefficient (ADC) generated by measuring identical images at different b‑values and represented as ADC map, from which the ADC value was calculated. Diagnosis was confirmed after the MRI examination by histologic biopsy according to standard histopathological procedures.
In our study, the average ADC value of lesions was significantly different between benign and malignant sinonasal lesions (p<0.001).
We concluded that the sensitivity of ADC in differentiating benign from malignant lesions in our study was 92.3% indicating a high true positive rate. Hence, if the average ADC is below 0.995 × 10‑3 mm2/sec, there is high probability that the mass will be malignant with high specificity of 77.8%.
Our results revealed that the mean ADC value of benign and malignant sinonasal lesions were 1.25 ± 0.52 × 10‑3 mm2/sec and 0.67 ± 0.29 × 10‑3 mm2/sec respectively. The mean ADC value of benign was significantly higher than that of malignant lesions (p<0.0001).
In agreement of the results of our study is Sasaki et al., 2011; a study that was preformed on 61 patients (44 males and 17 females; average age, 62 ± 17 years; age range, 16–86 years) with histologically proved benign lesions, including tumor like organized hematomas, malignant tumors, and inflammatory lesions. The histology of these lesions included 19 benign lesions (7 inverted papillomas, 5 organized hematomas, 4 hemangiomas, and 3 angiofibromas); 28 malignant tumors (12 SCCs, including 5 poorly differentiated SCCs, 3 moderately differentiated SCCs, 3 well‑differentiated SCCs, and 1 nonkeratinizing SCC; 6 malignant lymphomas; 2 undifferentiated carcinomas; 2 metastatic renal cell carcinomas; 1 spindle‑cell carcinoma; 1 melanoma; 1 olfactory neuroblastoma; 1 pleomorphic Rhabdomyosarcoma; 1 adenocarcinoma; and 1 Adenoid Cystic Carcinoma) and 14 inflammatory lesions (5 rhinosinusitis, 5 inflammatory polyps, and 4 fungus infections).
The Apparent Diffusion Coefficient (ADC) value of malignant tumors (0.87 ± 0.32 × 10‑3 mm2/sec) were significantly lower than those of benign (1.35 ± 0.29 × 10‑3 mm2/sec, P<0.0001) and inflammatory (1.50 ± 0.50 × 10‑3 mm2/sec, P=.0002) lesions.
They concluded that overall ADCs of malignant tumors were significantly smaller than those of benign and inflammatory lesions. An ADC cut‑off point of 0.84 × 10‑3 mm2/sec was best for differentiating benign/inflammatory lesions from malignant tumors; it provided diagnostic ability of 75% sensitivity, 94% specificity, 85% accuracy, and 91% positive and 82% negative predictive values (Sasaki M, et al., 2011).
The minute difference in cut off value in our study; may be attributed to the high percentage of malignant cases in their study, thus lowering the mean ADC value.
Similar to our study the ADC values demonstrated differentiation in malignant tumor subtypes like lymphomas with the lowest overall ADCs and the greatest percentages of total tumor areas with extremely low and/or low ADCs among the malignant tumors. Overall ADCs of lymphomas were significantly lower than other malignancies.
Our results also go hand in hand with the results of the study done by (Das A, et al., 2017) this study was done on 28 patients, the majority were males (n=21, 75%) with a mean age of 38.95 years (range: 10 to 66 years). Overall, there were more malignant (n=18, 64.2%) than benign lesions on final histology. All the benign lesions were present in males (n=10, 100%), who also had two‑thirds of the malignant lesions (n=12, 66.67%).The mean age of patients with malignant lesions was higher (mean: 50.56 years, range: 30 to 70 years) than that of patients with benign lesions (mean: 22.1 years, range: 10 to 52 years), and the difference was statistically significant.
The sensitivity, specificity, positive predictive value and negative predictive value of DWI in differentiating between benign and malignant sinonasal masses were: 72.7%, 90%, 92.9%, and 64.3% respectively. A cut‑off ADC value of 1.79 × 10‑3 m2/sec yielded a sensitivity of 80%, specificity of 83.3%, with area under the curve of 0.83, which was statistically significant for the characterization of malignant lesions (Das A, et al., 2017).
They also observed that malignant lymphomas arising in the sinonasal region were associated with extremely low ADCs (ADC value is lower than 0.483 ± 0.079 × 10‑3 mm2/sec). This agrees with our observations in our study as the mean ADC value for lymphoma was 0.38 ± 0.26 × 10‑3 mm2/ sec.
The increase in Mean ADC value of benign lesions and the cut off value between benign and malignant lesions in their study; may be attributed to the small number of patients, small percentage of benign lesions (about 36%) and high percentage Juvenile nasopharyngeal angiofibroma which present about 70% of their benign lesions with mean ADC value about 2.169 ± 0.270 × 10‑3 mm2/sec.
In their study Wang XY, et al.included a total of 197 retrospective patients with sinonasal tumors. The diagnosis of 81 benign tumors (57 males and 24 females; mean age, 45.11 ± 16.33 years) and 116 malignant tumors (66 males and 50 females; mean age, 49.06 ± 16.44 years). The most common histologic types of the tumors were as follows: inverted papilloma (n=48), lymphoma (n=22), Adenoid Cystic Carcinomas (n=16), Malignant melanoma (n=11), SCC (n=11), Rhabdomyosarcoma (n=10), inverted papilloma with malignant transformation (n=10), Olfactory neuroblastoma (n=9), hemangioma (n=9) and schwannoma (n=5).
The mean ADCs of malignant sinonasal tumors (1.084 × 10‑3 mm2/sec) were significantly lower than those of benign tumors (1.617 × 10‑3 mm2 sec, P<0.001). The accuracy using WS ADCs b0,1000 alone was 83.7% in differentiating the benign from the malignant tumors (85.3% sensitivity, 81.2% specificity, 86.4% positive predictive value, and 79.5% negative predictive value) (Wang XY, et al., 2015).
Jiang et al., 2017 examined 81 patients with sino‑nasal lesions, 26 were females and 55 were males. The age of patients ranged from 14 to 79 year old, with a mean age of 53.2 year. The malignant lesions were 46 cases including squamous cell carcinoma (n=17), olfactory neuroblastoma (n=7), Adenoid Cystic Carcinoma (n=5), Rhabdomyosarcoma (n=5), melanoma tumor (n=5), lymphoma (n=3), undifferentiated carcinoma (n=2), malignant fibrohistiocytoma (n=1), and osteosarcoma (n=1). Benign lesions were 35 cases including inflammatory polyps (n=22), papilloma (n=7), spindle cell tumor (n=3), fibrous tumor of bone (n=2), and enamel cell tumor (n=1).
They concluded that overall ADCs of malignant tumors were significantly lower than those of benign and inflammatory lesions. The mean ADC value of malignant sinonasal masses was (1.11 ± 0.41 × 10‑3 mm2/sec), which was significantly lower than that of benign masses (1.58 ± 0.50 × 10‑3 mm2/sec) (P<0.001). The Receiver Operating Characteristic curve analyses yielded a cutoff ADC value of 1.27 × 10‑3 mm2/sec for differentiating between benign and malignant lesions, with a sensitivity of 69.6%, a specificity of 77.1% and an accuracy of 74.0% (Jiang JX, et al., 2017).
Similar to our study there was also difference between subtypes of malignant lesions with significant lower ADC values in lymphomas (ADC value was 0.75 ± 0.29 × 10‑3 mm2/sec) than other malignant lesions.
There was a difference in the benign mean, range and cut off ADC values between our and their study may be due to high percentage of inflammatory lesions (more than 60%) which have high ADC values.
Razek AA, et al.study included 55 patients (34 males, 21 females; aged 1464 years, mean 39 years) with nasal and paranasal sinus masses. There were malignant tumors (n=38) and benign lesions (n=12).
The malignant tumors (n=27) comprised squamous cell carcinoma (n=20), undifferentiated carcinoma (n=3), mucoepidermoid carcinoma (n=3) and Adenoid Cystic Carcinoma (n=1), while sarcomas (n=11) comprised non‑Hodgkin’s lymphoma (n=4), Rhabdomyosarcoma (n=3), olfactory neuroblastoma (n=2), chondrosarcoma (n=1) and osteosarcoma (n=1). The benign tumors (n=12) included juvenile angiofibroma (n=4), inverted papilloma (n=3), inflammatory polyps (n=3), ossifying fibroma (n=1) and aneurysmal bone cyst (n=1).
The mean ADC value of nasal and paranasal sinus malignant lesions (1.10 ± 0.25 × 10‑3 mm2/sec) was significantly different (P=0.001) from that of benign lesions (1.78 ± 0.41 × 10‑3 mm2/sec). Using an ADC value of 1.53 × 10‑3 mm2/sec as the threshold value for differentiating malignant from benign lesions, the best result obtained had an accuracy of 93%, sensitivity of 94%, specificity of 92%, a positive predictive value of 92% and negative predictive value of 94% (Razek AA, et al., 2009).
Xiao et al., 2018 study included 131 patients, 56 patients with benign sinonasal lesions and 75 with malignant sinonasal lesions. These patients, 48 were female and 83 were male. The age of patients ranged from 16 to 79 years, with a mean age of 48.67 years.
The benign tumors inflammatory polyps (n=28) inverted papilloma (n=14) fibroangioma (n=5) spindle cell tumor (n=4) schwannoma (n=2) ossifying fibroma (n=2) enamel cell tumor (n=1). The malignant tumors squamous cell carcinoma (n=23) olfactory neuroblastoma (n=13) malignant melanoma (n=12) Rhabdomyosarcoma (n=9) lymphoma (n=6) Adenoid Cystic Carcinoma (n=5) undifferentiated carcinoma (n=2) osteosarcoma (n=2) neuroendocrine carcinoma (n=2) malignant fibrohistiocytoma (n=1) (Xiao Z, et al., 2018).
In agreement without study they concluded that the ADC value from conventional DWI may be helpful for discriminating markers in the differentiation of benign and malignant sinonasal lesions with mean ADC value 1.163 ± 0.354 × 10‑3 mm2/sec for benign lesions and 0.862 ± 0.258 × 10‑3 mm2/sec for malignant lesions (P value=0.001) with sensitivity of 80% and specificity of 54.7%.
This study included 24 patients with sinonasal masses. They were 8 women (33.3%) and 16 men (66.7%). Their ages ranged from 10 to 68 years with a mean of 38.5 years. As for histopathology, the most common documented sinonasal diseases were inflammatory disease (12 cases, 50%) then inverted papilloma (3 cases, 12.5%), which represented the most common benign tumors followed by squamous cell carcinoma (3 cases, 12.5%), which represented the most common malignant tumors.
On using ADC value of 1.2 × 10‑3 mm2/sec as a cut‑off value for differentiating benign from malignant sinonasal lesions, they achieved 90% accuracy, 100% sensitivity, 88.4% specificity, 77.8% positive predictive value, and 100% negative predictive value. At this cut‑off, benign lesions show statistically significant higher ADC value than malignant tumors (El‑Gerby KM and El‑Anwar MW, 2017).
The major limitation of our study was that it has been done on wide range of pathologies, thus the numbers of the lesions in each category were few. So further separate studies dedicated to different pathological entities may provide differentiation between tumor types.
In our study there were striking false results on basis of ADC value, in patients with Fibrous Dysplasia and fungal sinusitis. Most of the calculated ADC values for Fibrous Dysplasia (FD) were very low (below 0.6 with mean 0.66 × 10‑3 mm2/sec) and some of the calculated ADC values for fungal sinusitis were low (below 0.5 with mean 1.07 × 10‑3 mm2/sec). This can be explained by the fact that Fibrous Dysplasia (FD) lesions ADC value depends on their ossification and density the more dense lesions the lower ADC values and in fungal sinusitis variable degree of cellularity affected the ADC values.
Conclusion
In conclusion, the introduction of DWI and the ADC to the study of paranasal cavity disorders has improved the quality of the diagnostic hypothesis, particularly in the differentiation between benign and malignant masses. In addition, the differences in ADC values between certain types of neoplasms could be assessed, such as lymphoma and leukemias from carcinoma. A unique ADC cut‑off value for differentiating benign from malignant disease could not be established, mainly due to the heterogeneity of methods applied for the ADC assessment, or even the heterogenicity of the samples evaluated in each study. Overall, DWI and the ADC are promising methods that can be conveniently incorporated into routine evaluations as it can help in the differentiation of malignant tumors from benign lesions, and in the characterization and grading of malignancies.
References
- Wang XY, Yan F, Hao H, Wu JX, Chen QH, Xian JF. Improved performance in differentiating benign from malignant sinonasal tumors using diffusion-weighted combined with dynamic contrast-enhanced magnetic resonance imaging. Chin Med J. 2015; 128(5): 586.
- Sakamoto J, Imaizumi A, Sasaki Y, Kamio T, Wakoh M, Otonari-Yamamoto M, et al. Comparison of accuracy of intravoxel incoherent motion and apparent diffusion coefficient techniques for predicting malignancy of head and neck tumors using half-fourier single-shot turbo spin-echo diffusion-weighted imaging. Magn Reson Imaging. 2014; 32(7): 860-866.
- Gomaa MA, Hammad MS, Abdelmoghny A, Elsherif AM, Tawfik HM. Magnetic resonance imaging versus computed tomography and different imaging modalities in evaluation of sinonasal neoplasms diagnosed by histopathology. Clin Med Insights Ear Nose Throat. 2013; 6: 10678.
- Mohaghegh P, Rockall AG. Imaging strategy for early ovarian cancer: Characterization of adnexal masses with conventional and advanced imaging techniques. Radiographics. 2012; 32(6): 1751-1773.
- Wan Q, Deng YS, Lei Q, Bao YY, Wang YZ, Zhou JX, et al. Differentiating between malignant and benign solid solitary pulmonary lesions: Are intravoxel incoherent motion and diffusion kurtosis imaging superior to conventional diffusion-weighted imaging? Eur Radiol. 2019; 29(3): 1607-1615.
- Sasaki M, Sumi M, Eida S, Ichikawa Y, Sumi T, Yamada T, et al. Multiparametric MR Imaging of sinonasal diseases: Time-signal intensity curve-and apparent diffusion coefficient-based differentiation between benign and malignant lesions. Am J Neuroradiol. 2011; 32(11): 2154-2159.
- Abdel Razek AA, Nada N. Role of diffusion-weighted MRI in differentiation of masticator space malignancy from infection. Dentomaxillofac Radiol. 2013; 42(4): 20120183.
- Elsherbini AA, Saber M, Aggag M, El-Shahawy A, Shokier HA. Magnetic nanoparticle-induced hyperthermia treatment under magnetic resonance imaging. Magn Reson Imaging. 2011; 29(2): 272-280.
- Law BK, King AD, Ai QY, Poon DM, Chen W, Bhatia KS, et al. Head and neck tumors: Amide proton transfer MRI. Radiology. 2018; 288(3): 782-790.
- Koehli M, Dunet V, Montemurro M, Leyvraz S, Meuli R, Prior J, et al. Diffusion-weighted MRI in metastatic gastrointestinal tumours (GIST): A pilot study on the assessment of treatment response in comparison with 18 F-FDG PET/CT. Eur Radiol. 2011.
- Razek AA, Sieza S, Maha B. Assessment of nasal and paranasal sinus masses by diffusion-weighted MR imaging. J Neuroradiol. 2009; 36(4): 206-211.
- Eggesbø HB. Imaging of sinonasal tumours. Cancer Imaging. 2012; 136.
- Wippold FJ. Head and neck imaging: The role of CT and MRI. J Magn Reson Imaging. 2007; 25(3): 453-465.
- Zou J, Man F, Deng K, Zheng Y, Hao D, Xu W. CT and MR Imaging findings of sinonasal angiomatous polyps. Eur J Radiol. 2014; 83(3): 545-551.
- Munhoz L, Júnior RA, Abdala R, Arita ES. Diffusion-weighted magnetic resonance imaging of the paranasal sinuses: A systematic review. Oral Surg Oral Med Oral Pathol Oral Radiol Endod. 2018; 126(6): 521-536.
- ElSaid NA, Nada OM, Habib YS, Semeisem AR, Khalifa NM. Diagnostic accuracy of diffusion weighted MRI in cervical lymphadenopathy cases correlated with pathology results. Egypt J Radiol Nucl. 2014; 45(4): 1115-1125.
- Das A, Bhalla AS, Sharma R, Kumar A, Thakar A, Vishnubhatla SM, et al. Can diffusion weighted imaging aid in differentiating benign from malignant sinonasal masses? A useful adjunct. Pol J Radiol. 2017; 82: 345.
- Jiang JX, Tang ZH, Zhong YF, Qiang JW. Diffusion kurtosis imaging for differentiating between the benign and malignant sinonasal lesions. J Magn Reson Imaging. 2017; 45(5): 1446-1454.
- Xiao Z, Tang Z, Qiang J, Wang S, Qian W, Zhong Y, et al. Intravoxel incoherent motion MR Imaging in the differentiation of benign and malignant sinonasal lesions: Comparison with conventional diffusion-weighted MR Imaging. Am J Neuroradiol. 2018; 39(3): 538-546.
- El-Gerby KM, El-Anwar MW. Differentiating benign from malignant sinonasal lesions: Feasibility of Diffusion Weighted MRI. Int Arch Otorhinolaryngol. 2017; 21: 358-365.
Author Info
Ayda A. Youssef1, Mostafa Elkhashab2*, Talaat Hassan2, Mohamed H. Zedan3 and Ramy Edward Asaad22Department of Diagnostic Radiology, Cairo University, Giza, Egypt
3Department of Surgical Oncology, National Cancer Institute, Cairo University, Giza, Egypt
Citation: Youssef AA: The Value of Adding MR Diffusion Weighted Imaging to the Conventional Post Contrast MRI Study in Characterization of Sino-nasal Lesions
Received: 04-Aug-2021 Accepted: 18-Aug-2021 Published: 25-Aug-2021
Copyright: This is an open access article distributed under the terms of the Creative Commons Attribution License, which permits unrestricted use, distribution, and reproduction in any medium, provided the original work is properly cited.
ARTICLE TOOLS
- Dental Development between Assisted Reproductive Therapy (Art) and Natural Conceived Children: A Comparative Pilot Study Norzaiti Mohd Kenali, Naimah Hasanah Mohd Fathil, Norbasyirah Bohari, Ahmad Faisal Ismail, Roszaman Ramli SRP. 2020; 11(1): 01-06 » doi: 10.5530/srp.2020.1.01
- Psychometric properties of the World Health Organization Quality of life instrument, short form: Validity in the Vietnamese healthcare context Trung Quang Vo*, Bao Tran Thuy Tran, Ngan Thuy Nguyen, Tram ThiHuyen Nguyen, Thuy Phan Chung Tran SRP. 2020; 11(1): 14-22 » doi: 10.5530/srp.2019.1.3
- A Review of Pharmacoeconomics: the key to “Healthcare for All” Hasamnis AA, Patil SS, Shaik Imam, Narendiran K SRP. 2019; 10(1): s40-s42 » doi: 10.5530/srp.2019.1s.21
- Deuterium Depleted Water as an Adjuvant in Treatment of Cancer Anton Syroeshkin, Olga Levitskaya, Elena Uspenskaya, Tatiana Pleteneva, Daria Romaykina, Daria Ermakova SRP. 2019; 10(1): 112-117 » doi: 10.5530/srp.2019.1.19
- Dental Development between Assisted Reproductive Therapy (Art) and Natural Conceived Children: A Comparative Pilot Study Norzaiti Mohd Kenali, Naimah Hasanah Mohd Fathil, Norbasyirah Bohari, Ahmad Faisal Ismail, Roszaman Ramli SRP. 2020; 11(1): 01-06 » doi: 10.5530/srp.2020.1.01
- Manilkara zapota (L.) Royen Fruit Peel: A Phytochemical and Pharmacological Review Karle Pravin P, Dhawale Shashikant C SRP. 2019; 10(1): 11-14 » doi: 0.5530/srp.2019.1.2
- Pharmacognostic and Phytopharmacological Overview on Bombax ceiba Pankaj Haribhau Chaudhary, Mukund Ganeshrao Tawar SRP. 2019; 10(1): 20-25 » doi: 10.5530/srp.2019.1.4
- A Review of Pharmacoeconomics: the key to “Healthcare for All” Hasamnis AA, Patil SS, Shaik Imam, Narendiran K SRP. 2019; 10(1): s40-s42 » doi: 10.5530/srp.2019.1s.21
- A Prospective Review on Phyto-Pharmacological Aspects of Andrographis paniculata Govindraj Akilandeswari, Arumugam Vijaya Anand, Palanisamy Sampathkumar, Puthamohan Vinayaga Moorthi, Basavaraju Preethi SRP. 2019; 10(1): 15-19 » doi: 10.5530/srp.2019.1.3

