Review Article - (2021) Volume 12, Issue 11
Characterization of Drug Delivery Particles in Pharmaceutical Disperse Systems: A Review
Ghazi ME Hussein1*, Babiker M Elhaj2 and Heyam Saad Ali3Abstract
This review focuses on micromerties which is the science and technology of small particles. Pharmaceutical particle and powder characterization is key to pharmaceutical manufacturing processes and products as they often involve bulk powders in pharmaceutical dispersed systems. Particle size and powder properties will influence physical properties, such as the flowability of a powder, and in turn, will impact processing, blending, dissolution, delivery and bioavailability. Moreover, the appropriate selection of methods and particle engineering technologies of their production, characterization, are critical issues need considerations. Furthermore, optimization of their production process along with the drug/excipient particles, can provide insight understanding of their in vivo behaviour. In particular, characterization techniques for particle size distribution and morphology, drug loading structure of matrix components, porosity, particle surface chemistry, surface charge, are discussed in this review.
Keywords
Characterization techniques, Particle size and distribution, Powder characteristics, Powder morphology
Introduction
Micrometrics is the science and technology of small particles, that deals with fundamental studies associated with characteristics of particles. Particle’s properties are important in all pharmaceutical dosage forms, since they are related to the physicochemical, pharmacological properties, solubility, release, distribution, and bioavailability of the drug. Particle Properties such as the particle size, particle size distribution governs the manufacturing behaviour of the material in terms of their rheology, powder density, powder packing, surface area, glossiness. They are affected by environmental factors such as humidity, temperature, radiation etc., which subsequently impact the stability of the solid, liquid and semisolids dosage forms. Therefore, combined knowledge of the technical manufacturing methods and the properties of particles such as size, surface, shape is mandatory for the development of stable, safe and effective dosage forms. Hence, the selection of the appropriate techniques used for particle characterization relevant to their dosage forms and applications is critical. There are various techniques available at present including imaging modalities including light, electronic and advanced microscopy such as such as scanning electron, dynamic light scattering, and transmission.
The different pharmaceutical dispersed systems are classified and characterized by particles. (e.g., molecular dispersions, colloidal dispersions and course dispersions).
Colloidal dispersions are too small to be seen in the ordinary microscope, whereas the particles of pharmaceutical emulsions and suspensions and the fines of powders fall in the range of the optical microscope (D'Sa D, et al., 2014; Cocks E, et al., 2014).
The pharmaceutical systems with size ranges of particles are listed in the following table (Verwey EJ, 1947; Lan Y, et al., 2018) (Table 1).
| Class | Range of particle size micrometers (µm) | Microscopic characteristics | Examples |
|---|---|---|---|
| Molecular dispersions | 1<1 nm | Invisible in electron microscope | syrup, elixir |
| Colloidal 4dispersions | 1 nm-0.5 µm | Visible in electron microscope | Colloidal silver solutions |
| Coarse dispersions | 0.5-10 µm | Visible under microscope | Suspensions |
| 10-50 µm | Fine emulsions | ||
| 50-100 µm | Flocculated Suspensions |
Table 1: Range of particle size in pharmaceutical disperse system (Verwey EJ, 1947; Lan Y, et al., 2018)
Applications of micromeritics:
1. Particle size and distribution has a potential impact on dos- age rapid solution formulation forms (Chen B, et al., 2012; Mengual O, et al., 1999; Daniels R and Knie U, 2007; Rowland CM, et al., 2019; Boxall JA, et al., 2012).
2. The particle size is the function of surface area; it has poten- tial to increase physical chemical and pharmacological proper- ties of drug molecules.
3. The pattern of drug release form dosage forms is influenced by the Particle size in almost all roots of administration in- cluding oral, parenteral, rectal, topical etc. (Castellanos A, et al., 1999).
4. Physical stability of emulsion and suspension is related to the minimum particle Size achieved during processing (Shri- vastava AR, et al., 2009).
5. In tablet and capsule technology, the control of particle size and particle size distribution are extremely important to man- age good flow properties required for the uniformity of unit dose (Raghavan SR, et al., 2000).
6. Physical appearance of ointments, pastes and creams is in- fluenced by particle size particle size distribution (Becher P, 2005; Tabibi SE and Rhodes CT, 1996; Ali HS, et al., 2019).
7. Rate of drying is affected by particle size and particle size distribution.
8. Extraction is related to surface area or Particle size.
Particle Size and Particle Size Distribution
In heterogenous collections (eg. powder, emulsion, suspension) of particles two fundamental properties are important (Ansel HC, etal., 1995; Beetstra R, etal., 2009; Phan‐Quang GC, etal., 2015).
1. Shape and surface area of individual particles.
2. Size and number of particles corresponding to each range (particle size distribution) (Figure 1).

Figure 1: Frequency distributions of (a) roundness factor and (b) aspect ratio for powder sample (Wang H, et al., 2019)
Expression of asymmetrical particles
In order to measure the particle size some parameters are used such as sphere size could be expressed in term of diameter, (Equivalent Spherical diameter) (Gürbüz S, et al., 2015).
Equivalent spherical diameter can be defined as diameter of sphere having the same surface area or volume or diameter (length) (Azarbayjani AF, etal., 2009). Various equivalent spherical diameters are available (Fishler R, etal., 2018).
1. Surface diameter: Diameter for sphere having the same surface diameter area as the particle in question.
2. Volume diameter: Diameter of sphere having the volume as the particle.
3. Stokes’s diameter: Diameter of sphere having the same rate of sedimen- tation as the asymmetric particle (Derksen JJ, 2014; Kessler DP and York JL, 1970).
4. Projected diameter: The diameter of sphere having surface area similar to that of particle when viewed to its most stable plan.
5. Sieve diameter: Diameter of sphere having the sieving properties similar to that of asymmetrical particle (Eum K, etal., 2015) (Figures 2 and 3).
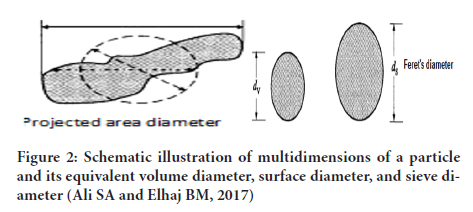
Figure 2: Schematic illustration of multidimensions of a particle and its equivalent volume diameter, surface diameter, and sieve diameter (Ali SA and Elhaj BM, 2017)
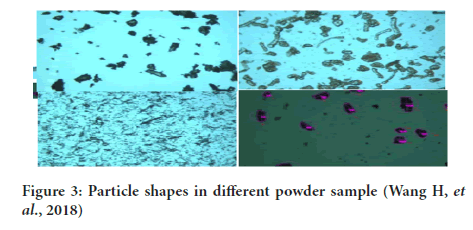
Figure 3: Particle shapes in different powder sample (Wang H, et al., 2018)
The type of equivalent diameter obtained depends on the method of analysis e.g. microscopic technique will give projected diameter, sedimentation tech- nique will give stokes diameter while sieving technique will give sieve diameter and so on.
Expression of size for polydisperse system
Collection of particles may not be only asymmetrical but also polydisperse. In such situation it is not enough to measure the size of few particles but also necessary to known as to how many particles corresponding to each size that present in the sample. Therefore, the size range, the number or weight fraction corresponding to each size range and the average particle size can be calculated and measured to express data Size for Polydisperse System (Senapati PC, et al., 2016; Pal R, 1996) (Figure 4).
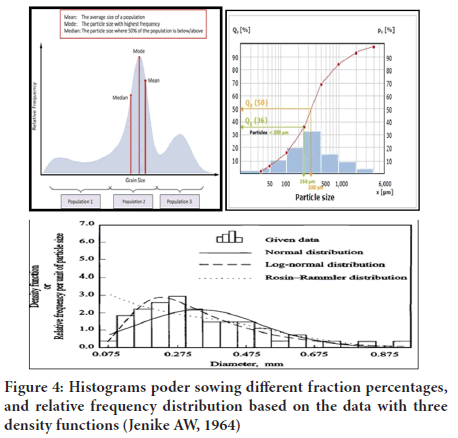
Figure 4: Histograms poder sowing different fraction percentages, and relative frequency distribution based on the data with three density functions (Jenike AW, 1964)
Average particle size
Microscopy is one of the technique available for particle size analysis and de- termination of particle size distribution. In this method 200-500 particles are measured individually for their sizes. The average particle size then calculated (Saen-Isara T, etal., 2017; Karg MC, etal., 2019).
Particle size distribution
Various methods available for presentation of Particle size distribution data, obtained by Particle size analysis (da Rosa Chagas AG, et al., 2017; Reddy MM, et al., 2019).
1. % age frequence distribution curve. Particle plotting size vsfrequency (Numberer or rate of a particles corresponding to each size range).
2. Cumulative % frequency distribution.
Log normal distribution => for pharmaceutical systems show asymmetrical type of distribution. The normal probability plot indicate log normal distribu- tion is plotted (Figure 5).
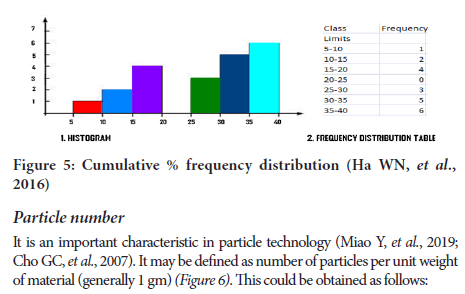
Figure 5: Cumulative % frequency distribution (Ha WN, et al., 2016)
Particle number
It is an important characteristic in particle technology (Miao Y, et al., 2019; Cho GC, etal., 2007). It may be defined as number of particles per unit weight of material (generally 1 gm) (Figure 6). This could be obtained as follows:
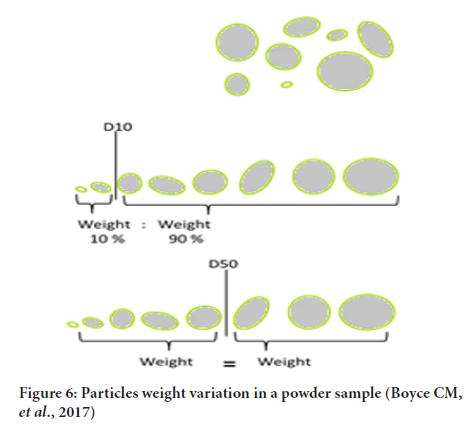
Figure 6: Particles weight variation in a powder sample (Boyce CM, et al., 2017)
Assuming that the particle is spherical, the volume of particle is obtained by the equation, we know density=mass/volume
Thus mass (weight) of single particle=density × volume
Determination of particle size
The particle size may be defined in terms of dimensions and shape 38, of parti- cle. The particle size may be determined by direct observation of the diameter or by calculating the diameter from particle volume or its surface area.
Large number of methods are available for determining particle size. However, those most frequently used in pharmacy and based on certain principle are shown in the table (Table 2).
| Method | Range applicable | |
|---|---|---|
| 1 | Optical microscopy | 0.2-100 μm |
| 2 | Electron | 0.005-1 μm |
| 3 | Sieving | above 33 μm |
| 4 | Sedimentation and elutriation | 2-50 μm |
| 5 | Coulter counters | 1-100 μm |
| 6 | Ultracentrifuge | 0.007-1 μm |
Table 2: Methods used for determining powder particle size 40
It is possible to determine particle size from the knowledge of surface area (specific surface), 2- methods are available to determine surface area (Figure 7)(Jensen RP, et al., 1999; Lu G, et al., 2015):
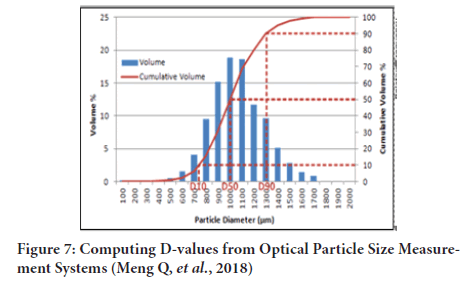
Figure 7: Computing D-values from Optical Particle Size Measurement Systems (Meng Q, et al., 2018)
1. Adsorption (0.005-10 μm).
2. Air permeability (5-100 μm).
In principle all methods would yield the same results if the particles were uniform in size, spherical, smooth and non –porous and of equal density (Figure 8).
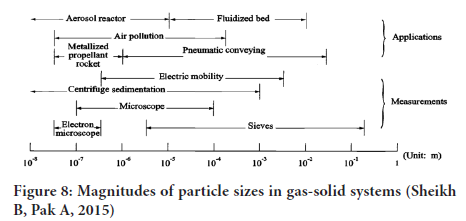
Figure 8: Magnitudes of particle sizes in gas-solid systems (Sheikh B, Pak A, 2015)
Microscopy, sieving and sedimentation are the most widely methdos used in pharmaceutical particle.
The choice of method of Particle size analysis depends on:
1. Particle size and size range present in sample.
2. The purpose for which the data (Particle size) is required.
Optical microscopy
Suitability: Most common technique employed in particle size analysis. Suitable for Particle size ranging between 0.2-100 μm. there are various techniques for image analysis such as Scanning electron microscope, Stereomicroscopy and SEM image analysis (Shokri-Kuehni SM, et al., 2018).
Methodology: (Lee JH, et al., 2016) Sample of emulsion or suspension, diluted or undiluted is placed on a slide or ruled cell and viewed through a microscope, by using a micrometer to measure the size of particles. The field can be projected on to a screen or a photograph can be taken of the slide and projected on a screen where the particle is measured more easily: particle distribution could be also studied (Figure 9).
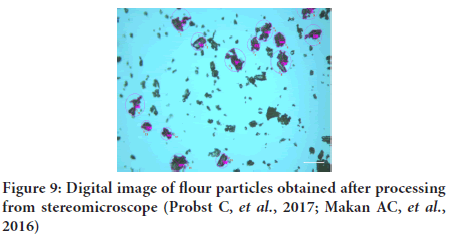
Figure 9: Digital image of flour particles obtained after processing from stereomicroscope (Probst C, et al., 2017; Makan AC, et al., 2016)
Advantages:
Most common technique employed in Particle size analysis (Cooper JT, etal., 2013).
Suitable for Particle size ranging between 0.2-100 µm.
Microscopic observation of a sample should always carry out even if other method of analysis is employed in order to know two aspects a. if there is a tendency to aggregation or agglomeration.
To confirm that the material is composed of single component.
Disadvantages:
1. The diameter is only obtained from only two dimensions of the particle (length+breadth), no estimation of the thickness (Johnson TF, et al., 2017).
2. This method is suitable for uniform spherical shape particles. For powder contains irregular, non-spherical shape tim brell microscope (double image microscopy) is used.
3. The method is slow and tedious because large number of particles must be counted (300-500 particles) in order to obtained a good estimation.
Electronic microscopy
Electronic counting devices are available which directly includes the Particle size measurement.
Sieving
Sieving or sifting is the process by which different grades of powders are sep- arated from each other. Sieving method used for measuring Particle size and Particle size distribution. It has many benefits including: being fast, simple and inexpensive (Prescott JK and Barnum RA, 2000).
Suitability: This method is basically meant for grading coarse powders. How- ever, if precautions are taken the method could be used for screening of parti- cles as smaller as 44 µm.
Nowadays electro-form sieves with size 5-30 µm are available as a result sieving could be used to determine the Particle size ranging from 5-30 µm.
Methodology: Series of sieves are arranged with at least 4-5 sieves with course sieve being kept at top. Suitable amount of material is accurately weighted kept on top sieve (Zheng J and Hryciw RD, 2016). Whole system is kept on sieve shaker and shaken at optimum intensity for predetermined time. At the end of this period, material obtained in each sieve is carefully removed and weighed and each of each fraction is assigned a particle size by one of the two methods. In one method the material is assigned to the particle size of the size of opening of the sieve through which it has passed or in which it has retained. In recent years material retained on specific sieve that is assigned a size which is either arithmetic or geometric mean of two successive sieves i.e. the sieve through which material has passed and the sieve on which material is retained.
Advantages:
1. This method is easy, simple (Kaerger JS, et al., 2004).
2. Inexpensive
3. Rapid.
Disadvantages: It is difficult to obtain correct results because of the following reasons:
1. Overloading of sieves may result in errors, if insufficient time for shaking allowed may not give correct results (Cheong FC, et al., 2011).
2. Due to electrostatic attraction between particles the aggregates may be formed which will not pass through he sieve.
3. Due to humidity, the hygroscopic powders may lead to aggregation (Ali SA, et al., 2016).
4. Particle shape has a great influence to pass the mesh. The particles with spherical shape pass the mesh without any difficulty whereas plate like or long fibrous particles have to be titled into an upright position to pass the mesh.
5. When the material is agitated with high intensity, attribution of size reduction of granular pharmaceutical material generally takes place. Therefore, it is necessary that sieving must be carried out at intensity and for the time that is sufficient to a chieve sieving equilibrium without change in particle size.
Sedimentation (Pipette method): Using Andreason apparatus or pipette:
• This is the most reliable method for the analysis of fine powders in coarse dispersions like emulsions and suspensions.
• This method is based on the measurement of the rate at which particles of powder settle out from a liquid in which they have been dispersed (Figure 10).
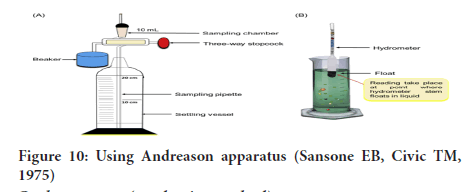
Figure 10: Using Andreason apparatus (Sansone EB, Civic TM, 1975)
Coulter counter (conducting method)
This method based on volume measurement that has been first been designed by coulter counter corporation USA. Electrical resistance will be proportional to the volume of particle (Cossu A, et al., 2015).
Advantages:
• This method can count as count as many as 4000 particles/second. As a result, the particle size analysis could be complete within few minutes (Rapid method) (Maheshwari R, et al., 2016).
• The counting is by electronic method, so the method is most accurate.
• The result is expressed in terms of particle volume from which it is a simple matter to calculate the diameter of the sphere of equivalent volume.
• The sphere of equivalent volume is defined as the sphericity descriptor in the circumscribing sphere.
• The instrument can operate with particles between 0.5-1000 micrometers.
Disadvantages:
• It is not possible to have the knowledge of shape because the Particle size analysis is based on volume measurement (Kim W, et al., 2018).
• The material must be suspended in an electrolytic liquid but non-aqueous electrolytes are available for water soluble materials.
Elutriation
It is a procedure in which the fluid moves in a direction opposite to the sedimentation movement (Hettler EN, et al., 2011).
Particle Shape and Surface Area
Knowledge of particle shape and surface area is extremely important in particle technology (Zheng L, et al., 2019). For example, Particle shape can influence:
Flow properties (Tablet technology)
• Packing properties (Capsule) (Ye C, et al., 2019; Bouwman AM, et al., 2004).
• Surface area (to some extent) (McCarthy CA, et al., 2018) (Figure 11).
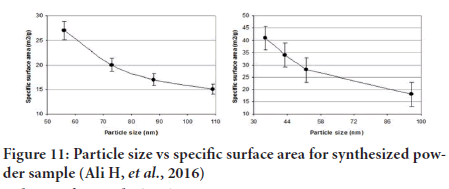
Figure 11: Particle size vs specific surface area for synthesized powder sample (Ali H, et al., 2016)
Particle shape
A sphere has minimum surface, it has a definite volume (Waschke J, et al., 2019). More asymmetrical the particle greater will be the surface area for unit volume sphere could be characterized in terms of diameter, as a result it is relatively easier to determine the surface are and volume of Spherical Particles (SP).
Volume of particle (VO)
From equations it clear that the surface area is proportional to the square of diameter and volume is proportional to cube of diameter (Liu X, et al., 2019).
The particle becomes increasingly as asymmetrical, it is more and difficult to assign meaningful diameter to the particle. Hence measuring of equivalent spherical diameter is possible by microscopic method to compute surface area.
Projected diameter (dp) is frequently available and possible to measure The more asymmetric the particle the more the value of shape factor>6.
Specific surface
May be defined as surface area occupied by unit volume (Sv) or per unit weight (Sw).
Surface area is influence mainly by three factors (Phan‐Quang GC, et al., 2015)
• Particle size
• Amount of sample
• Shape.
Surface area (Oh JM, et al., 2019) based on amount of sample, but does not have any influence on physico-chemical properties related to the surface area and hence in order to compare the surface area of different samples of material it is appropriate to keep the weight or amount of material constant. Hence, specific surface is the term that is commonly used to evaluate the surface area.
Specific area (Ianoş R, et al., 2017) is a combined function of surface area and volume, as a result the meaningful diameter combinig both the aspects will be surface volume diameter, which could be obtained by surface area per unit weight.
Measurement of surface area
Available methods may be classified into two groups (Giri SD, Sarkar A, 2018)
• Indirect methods
• Direct methods.
It is possible to compute surface area indirectly by the methods available for particle size analysis and hence indirect methods (El-Haj BM, et al., 2007) include:
• Microscopy (Hichri Y, et al., 2019)
• Sedimentation
• Coulter counter
• Seiving.
Direct methods: Liquid solute that to form a monolayer is a direct function of the surface are of the sample (Ali U, et al., 2019).
• Adsorption: The amount of gas or adsorbed on to the sample of powder (Madani SH, et al., 2018).
• Air-permeability: Depends on the rate at which a gas or liquid permeates a bed of powder is relted to the surface are exposed to permanent (Nosko M, et al., 2019).
Derived Properties of Powders
There are two fundamental properties for collection of particles i.e. Particle size and surface area (Yohannes B, et al., 2018). There are also different derived properties that are based upon the two above funda- mental properties. Since they depend on these fundamental properties, they are called derived properties (Shah UV, et al., 2015; Suliman RS, et al., 2017).
Some of these derived properties are particle dissolution and dissolu- tion rate.
Other derived properties are:
• Densities (Chou HT, et al., 2014; Liao CC, 2018)
• Porosity (Härtl J and Ooi JY, 2008)
• Packing arrangement (Chou HT, et al., 2014)
• Flow properties (Jange CG, Ambrose RK, 2019; Goh HP, et al., 2018)
Porosity
when a powder (eg. zinc oxide) is filled into graduted measuring cylinder the volume occupied by the powder is known as the bulk volume (Vb) (Holm R, et al., 2016). The bulk volume of the powder consists of the (true volume of the solid particles plus the volume of the spaces between the particles Vp (internal pores or capillary spec. The void volume indicates the volume of the spaces,
Thus, Vb=Vp + V
Packing arrangements
Ideal packing arrangements is to be taken as uniform size sphere (Koebernick N, et al., 2019). Uniform size sphere may take one of ideal packings:
• Closest (Rhombohedral).
• Most open or looset (cubic).
In practise (Garg V, et al., 2018), Porosity in closest packing is 26% and in loosest packng it is 48%. Also, the particles are neither spherical nor of same size. As a result it is assumed that they will undergo packing n between these two ideal arrangements. Thus, it is expected that practical powders should have porosity ranging from 26-48%. Practically it was observed that the porosity varies from 30-50%.
However, if the particle size distribution is used, small particles will fill the gap between large particles, as a result porosity may fall below theoratical minimum of 26%. If the particles have tendency to agglomeration, the initial between the particles will lead to much more looser packing, just like seen in flocculated a porosity may exceed theoretcial maximum of 48% it may be concluded that practical powders may have any degree of porosity.
Densities of particles
On one hand particles may be smooth and on other hand they may be rough and spongy. Therefore, it is necessary that care should be taken in pointing out the densities (Abdullah EC and Geldart D, 1999; Youd TL, 1973). Density may universally be defined as mass per unit volume. Mass remains unchanged, volume may change depending on internal pores or inter-particulate spaces (voids) are taken into an account.
There are 3 types densities, (Wong AC, et al., 2000):
• True density
• Granule density
• Bulk density.
True density: It may be defined as density of particle itself, exclusive of internal pores of the size greater than molecular atomic dimensions present in crystal lattices (Abdullah EC and Geldart D, 1999). Methods, available for measuring the true density are:
• Helium displacemnent
• Liquid displacement
• High pressure compression
• True density=m/Vp
Granule density: May be defined as density of particles including internal pores of the size smaller than 10 m (Santomaso A, et al., 2003).
Bulk density: It is a relative density type used for characterization of powder for quality control purposes (Cho G, et al., 2006).
Measures of demones: Best method for the measurement of true densities is Helium [He] displacement method. He is gas of choice because ti can enter into internal pores, at the same time it is not adsorbed on the particles. Density is measured by helium (He) Densitometer (El- Haj B, et al., 2008).
True density is available in literature are measured by liquid. Displacement method. Density obtained by this method may be differ from that obtained by Helium. He displacement method, depending on ability of liquid to penetrate into the internal pores. Liquid should be chosen properly as:
• Material should be insoluble in selected liquid.
• Material should be heavier.
• It should not inter-act with material.
• Liquid should preprably wet the material.
True density determination: Can be obtained by 2 methods (Stranzinger S, et al., 2019)
• Gas pycnometer helium true density measurement
• Measuring cylinder
Density may be defined as=wt/volume of liquid dispalced by same wt., while
Granule density: Granule density is obtained by mercury displacement method mercury inters into spaces between the particles. Displacement will be proportional to the volume of solid including the internal pores. The procedure is the same as that of liquid displacement method.
Bulk density: It is obtained by 3 tap methods according to USP procedure (cylinder method).
Importance of bulk density: Bulk density plays an important role in formulation of dosae form, it is more important than true density e.g.
• Bulk density affects tablet porosity=>tablet hardness, disintegration time which is one of the important quality control parameters of tablets. Thus, disintegration time influence absorption in G.I.T and physiological ability of drug.
• Bulk density may be used as test check for the uniformity of bulk materials.
• To determine the appropriate size of the container, mixing apparatus, hard gelatin capsule shape.
Factors influencing bulk density:
1. Particle size: Decrease particle size increases porosity and hence decrease bulk density (Meier C, et al., 2019).
(Vb increases) Vb=Vp + v
2. Particle size distribution: if the particle size distribution is wide small particles fill in the gaps between large particles. This will lead to heavy powder or the powders with high bulk density.
3. Particle shape: Any deviation from spherical shape will lead to a tendency towards loose packing resulting in light powders or the powders with low bulk density.
4. Tendency towards agglumeration: I the particles during packing undergo initial particle-particle bridging large space are left in the powdered bed resulting in powders with low bulk density.
Porosities: There are many porositis as the number of densities (Saw HY, et al., 2015).
• Intraparticle porosities as the number of densities.
• Interspace (E intraparticle)
• Total porosity is Interaporosity+Inter space.
Is defined as fraction of granule volume occupied by internal pores.
Bulkiness: (Etti CJ, et al., 2016) It is reciprocal of specific bulk volume. it is important in determining the size of container and the selection o of hard gelatin capsules.
Flow properties
Factor influencing flow properties of powders:
• Particle size
• Particle size distribution (Cheong FC, et al., 2011; Härtl J, Ooi JY, 2008; Johnston LJ, et al., 2009).
• presence of fine particles
• presence of moisture
• particle shape
• porosity and density
• surface texture.
Measurement of flow properties: It is measured in terms of angle of repose which is defined as the maximum angle between the surface of a pile and horizontal plane. Angle of repose is inverse function of flow properties (Nelson E, 1955; Ali I, et al., 2020; Yang FG, et al., 2009; Castellanos A, et al., 1999; Frączek J, et al., 2007; Zou RP and Yu AB, 1996).
It is named as static and dynamic according to the method of measurement, where the static by a pile and plane, and the other by a rotating cylinder as shown in the figure. Different methods are available to measure the Flowability based on the shear characteristics of a powder such as parallel plate shear tester, as figure. The most common reliable one is (2) funnel method. Powders can be classified in terms of their flowability using the angle of repose, as shown in the table (Figures 12 and 13) (Table 3).
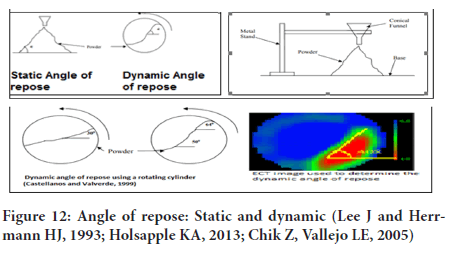
Figure 12: Angle of repose: Static and dynamic (Lee J and Herrmann HJ, 1993; Holsapple KA, 2013; Chik Z, Vallejo LE, 2005)
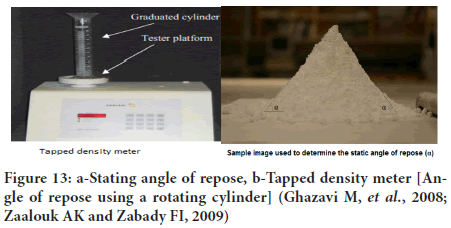
Figure 13: a-Stating angle of repose, b-Tapped density meter [Angle of repose using a rotating cylinder] (Ghazavi M, et al., 2008; Zaalouk AK and Zabady FI, 2009)
| Description | Angle of repose |
|---|---|
| Very free flowing | 25-30º |
| Free flowing | 30-38º |
| Fair to passable flow | 38-45º |
| Cohesive | 45-55º |
| Very cohesive | >55º |
Table 3: Classification of powders as per their flowabilities (Salehi H, et al., 2017; Yamane K, et al., 1995; Fowler RT and Wyatt FA, 1960)
Conclusion
Overall, our information supports the speculation that HIV disease causes cellular degradation in the lungs and proves that this impact is independent of smoking status. Further investigation should focus on understanding the organic components of how HIV contamination can accelerate the cycle of lung carcinogenesis. Given the large number of HIV-infected people who reported heavy smoking and who have smoked for longer periods of time because of their antiretroviral therapy, cellular breakdown in the lungs is likely to become an increasing problem for this population. A better understanding of the risk of smoking-related cell degradation in the lungs in HIV-infected individuals will help guide smoking cessation and improve interventions to decrease the effect of smoking. Close observation of cell degradation in the lungs of HIV-infected individuals and sharing of HIV-related information is warranted to study the risk of lung cell degradation related to markers of HIV infection and delayed use of HAART.
References
- D'Sa D, Chan HK, Kim HW, Chrzanowski W. Quantitative and qualitative examination of particle-particle interactions using colloidal probe nanoscopy. J Vis Exp. 2014; 89.
- Cocks E, Somavarapu S, Alpar O, Greenleaf D. Influence of suspension stabilisers on the delivery of protein-loaded porous poly (dl-lactide-co-glycolide) (PLGA) microparticles via pressurised Metered Dose Inhaler (pMDI). Pharm Res. 2014; 31(8): 2000-2009.
- Verwey EJ. Theory of the stability of lyophobic colloids. J Phys Chem. 1947; 51(3): 631-636.
- Lan Y, Caciagli A, Guidetti G, Yu Z, Liu J, Johansen VE, et al. Unexpected stability of aqueous dispersions of raspberry-like colloids. Nat Commun. 2018; 9(1): 1-8.
- Chen B, McClements DJ, Gray DA, Decker EA. Physical and oxidative stability of pre-emulsified oil bodies extracted from soybeans. Food Chem. 2012; 132(3): 1514-1520.
- Mengual O, Meunier G, Cayré I, Puech K, Snabre P. TURBISCAN MA 2000: multiple light scattering measurement for concentrated emulsion and suspension instability analysis. Talanta. 1999; 50(2): 445-456.
- Daniels R, Knie U. Galenics of dermal products-vehicles, properties and drug release. JDDG: J Dtsch Dermatol Ges. 2007; 5(5): 367-383.
- Rowland CM, Shiffman D, Caulfield M, Garcia V, Melander O, Hastie T. Association of cardiovascular events and lipoprotein particle size: Development of a risk score based on functional data analysis. PloS one. 2019; 14(3): 0213172.
- Boxall JA, Koh CA, Sloan ED, Sum AK, Wu DT. Droplet size scaling of water-in-oil emulsions under turbulent flow. Langmuir. 2012; 28(1): 104-110.
- Castellanos A, Valverde JM, Pérez AT, Ramos A, Watson PK. Flow regimes in fine cohesive powders. Phy Rev Let. 1999; 82(6): 1156.
- Shrivastava AR, Ursekar B, Kapadia CJ. Design, optimization, preparation and evaluation of dispersion granules of valsartan and formulation into tablets. Curr Drug Deliv. 2009; 6(1): 28-37.
- Raghavan SR, Hou J, Baker GL, Khan SA. Colloidal interactions between particles with tethered nonpolar chains dispersed in polar media: direct correlation between dynamic rheology and interaction parameters. Langmuir. 2000; 16(3): 1066-1077.
- Becher P. Rheological properties of emulsions. Encyclopedia of Emulsions Technology. 2005; 1: 215-248.
- Tabibi SE, Rhodes CT. Disperse Systems. Modern Pharmaceutics. 1996; 299-331.
- Ali HS, Suliman RS, Elhaj BM, Suliman R. A Recent Progresses and Manufacturing Techniques in Pharmaceutical Powders and Granulation. Int J Pharm Clin Res. 2019; 11(1): 1-2.
- Ansel HC, Popovich NG, AllenJr LV. Pharmaceutical dosage forms and drug delivery systems. Williams and Wilkins. 1995.
- Beetstra R, Nijenhuis J, Ellis N, van Ommen JR. The influence of the particle size distribution on fluidized bed hydrodynamics using high‐throughput experimentation. AIChE journal. 2009; 55(8): 2013-2023.
- Phan‐Quang GC, Lee HK, Phang IY, Ling XY. Plasmonic colloidosomes as three‐dimensional SERS platforms with enhanced surface area for multiphase sub‐microliter toxin sensing. Angew Chem. 2015; 127(33): 9827-9831.
- Wang H, Nobes DS, Vehring R. Particle surface roughness improves colloidal stability of pressurized pharmaceutical suspensions. Pharm Res. 2019; 36(3): 43.
- Gürbüz S, Özmen Monkul B, İpeksaç T, Gürtekin Seden M, Erol M. A systematic study to understand the effects of particle size distribution of magnetic fingerprint powders on surfaces with various porosities. J Forensic Sci. 2015; 60(3): 727-736.
- Azarbayjani AF, Jouyban A, Chan SY. Impact of surface tension in pharmaceutical sciences. J Pharm Pharm Sci. 2009; 12(2): 218-228.
- Fishler R, Verhoeven F, de Kruijf W, Sznitman J. Particle sizing of pharmaceutical aerosols via direct imaging of particle settling velocities. Eur J Pharm Sci. 2018; 113: 152-158.
- Derksen JJ. Simulations of scalar dispersion in fluidized solid–liquid suspensions. AIChE Journal. 2014; 60(5): 1880-1890.
- Kessler DP, York JL. Characteristics of inclusions in the dispersed phase of liquid‐liquid suspensions. AIChE Journal. 1970; 16(3): 369-374.
- Eum K, Jayachandrababu KC, Rashidi F, Zhang K, Leisen J, Graham S, et al. Highly tunable molecular sieving and adsorption properties of mixed-linker zeolitic imidazolate frameworks. J Am Chem Soc. 2015; 137(12): 4191-4197.
- Ali SA, Elhaj BM. Approaches to Enhance Dissolution In Pharmaceutical Technologies. Am J Pharm Health Res. 2017; 5: 1-15.
- Wang H, Tan P, Barona D, Li G, Hoe S, Lechuga-Ballesteros D, et al. Characterization of the suspension stability of pharmaceuticals using a shadowgraphic imaging method. Int J Pharm. 2018; 548(1): 128-138.
- Senapati PC, Sahoo SK, Sahu AN. Mixed surfactant based (SNEDDS) self-nanoemulsifying drug delivery system presenting efavirenz for enhancement of oral bioavailability. Biomed Pharmacother. 2016; 80: 42-51.
- Pal R. Effect of droplet size on the rheology of emulsions. AIChE Journal. 1996; 42(11): 3181-3190.
- Jenike AW. Classification and Symbolization of Bulk Materials, Determination of apparent density-Funnel method, Storage and flow of solids. Bulletin 123 Univ Utah Engr Experimental Station. 1964.
- Saen-Isara T, Dechkunakorn S, Anuwongnukroh N, Srikhirin T, Tanodekaew S, Wichai W. Influence of the cross-linking agent on mechanical properties of PMMA powder with compromised particle morphology. Int Orthod. 2017; 15(2): 151-164.
- Karg MC, Munk A, Ahuja B, Backer MV, Schmitt JP, Stengel C, et al. Expanding particle size distribution and morphology of aluminium-silicon powders for Laser Beam Melting by dry coating with silica nanoparticles. J Mater Process Technol. 2019; 264: 155-171.
- da Rosa Chagas AG, Spinelli E, Fiaux SB, da Silva Barreto A, Rodrigues SV. Particle-size distribution (PSD) of pulverized hair: A quantitative approach of milling efficiency and its correlation with drug extraction efficiency. Forensic Sci Int. 2017; 277: 188-196.
- Reddy MM, Tiwari P, Singh A. Effect of carrier fluid rheology on shear-induced particle migration in asymmetric T-shaped bifurcation channel. Int J Multiph Flow. 2019; 111: 272-284.
- Ha WN, Shakibaie F, Kahler B, Walsh LJ. Deconvolution of the particle size distribution of ProRoot MTA and MTA Angelus. Acta Biomater Odontol Scand. 2016; 2(1): 7-11.
- Miao Y, Yu W, Hou Y, Guo L, Wang L. Investigating the functions of particles in packed aggregate blend using a discrete element method. Materials. 2019; 12(4): 556.
- Boyce CM, Ozel A, Rice NP, Rubinstein GJ, Holland DJ, Sundaresan S. Effective particle diameters for simulating fluidization of non‐spherical particles: CFD‐DEM models vs MRI measurements. AIChE Journal. 2017; 63(7): 2555-2568.
- Cho GC, Dodds J, Santamarina JC. Particle Shape Effects on Packing Density, Stiffness, and Strength: Natural and Crushed Sands. J Geotech Geoenviron Eng. 2007; 133(11): 1474.
- Meng Q, Fan H, Chen F, Xiao T, Zhang L. Preparation and characterization of Dendrobium officinale powders through superfine grinding. J Sci Food Agric. 2018; 98(5): 1906-1913.
- Jensen RP, Bosscher PJ, Plesha ME, Edil TB. DEM simulation of granular media-structure interface: effects of surface roughness and particle shape. Int J Numer Anal Meth Geomech. 1999; 23(6): 531-547.
- Lu G, Third JR, Müller CR. Discrete element models for non-spherical particle systems: From theoretical developments to applications. Chem Eng Sci. 2015; 127: 425-465.
- Sheikh B, Pak A. Numerical investigation of the effects of porosity and tortuosity on soil permeability using coupled three-dimensional discrete-element method and lattice Boltzmann method. Phys Rev E. 2015; 91(5): 053301.
- Shokri-Kuehni SM, Bergstad M, Sahimi M, Webb C, Shokri N. Iodine k-edge dual energy imaging reveals the influence of particle size distribution on solute transport in drying porous media. Sci Rep. 2018; 8(1): 1-9.
- Lee JH, Oh JW, Nam SH, Cha YS, Kim GH, Rhim WK, et al. Synthesis, Optical Properties, and Multiplexed Raman Bio‐Imaging of Surface Roughness‐Controlled Nanobridged Nanogap Particles. Small. 2016; 12(34): 4726-4734.
- Probst C, Zeng Y, Zhu RR. Characterization of protein particles in therapeutic formulations using imaging flow cytometry. J Pharm Sci. 2017; 106(8): 1952-1960.
- Makan AC, Spallek MJ, du Toit M, Klein T, Pasch H. Advanced analysis of polymer emulsions: particle size and particle size distribution by field-flow fractionation and dynamic light scattering. J Chromatogr A. 2016; 1442: 94-106.
- Cooper JT, Peterson EM, Harris JM. Fluorescence imaging of single-molecule retention trajectories in reversed-phase chromatographic particles. Anal Chem. 2013; 85(19): 9363-9370.
- Johnson TF, Levison PR, Shearing PR, Bracewell DG. X-ray computed tomography of packed bed chromatography columns for three dimensional imaging and analysis. J Chromatogr A. 2017; 1487: 108-115.
- Prescott JK, Barnum RA. On Powder Flowability. Pharm Technol. 2000; 60-84.
- Zheng J, Hryciw RD. Roundness and sphericity of soil particles in assemblies by computational geometry. J Comput Civ Eng. 2016; 30(6): 04016021.
- Kaerger JS, Edge S, Price R. Influence of particle size and shape on flowability and compactibility of binary mixtures of paracetamol and microcrystalline cellulose. Eur J Pharm Sci. 2004; 22(2-3): 173-179.
- Cheong FC, Xiao K, Pine DJ, Grier DG. Holographic characterization of individual colloidal spheres' porosities. Soft Matter. 2011; 7(15): 6816-6819.
- Ali SA, Elhaj BM, Saad R. Sustained release tablets using natural polymers. J Innov Pharm Biol Sci. 2016; 3(4): 85-91.
- Sansone EB, Civic TM. Liquid sedimentation analysis: media conductivity and particle size effects. Powder Technol. 1975; 12(1): 11-18.
- Cossu A, Wang MS, Chaudhari A, Nitin N. Antifungal activity against Candida albicans of starch Pickering emulsion with thymol or amphotericin B in suspension and calcium alginate films. Int J Pharm. 2015; 493(1-2): 233-242.
- Maheshwari R, Todke P, Kuche K, Raval N, Tekade RK. Micromeritics in Pharmaceutical Product Development. Dosage form design considerations. 2018; 599-635.
- Kim W, Bae J, Eum CH, Jung J, Lee S. Study on dispersibility of thermally stable carbon black particles in ink using asymmetric flow field-flow fractionation (AsFlFFF). Microchemical Journal. 2018; 142: 167-174.
- Hettler EN, Gulliver JS, Kayhanian M. An elutriation device to measure particle settling velocity in urban runoff. Sci Total Environ. 2011; 409(24): 5444-5453.
- Zheng L, Wang Z, Yin Y, Jiang R, Li B. Formation Mechanisms of Porous Particles from Self-Assembly of Amphiphilic Diblock Copolymers inside an Oil-in-Water Emulsion Droplet upon Solvent Evaporation. Langmuir. 2019; 35(17): 5902-5910.
- Ye C, Ali S, Sun Q, Guo M, Liu Y, Gao Y, et al. Novel cone-and-plate flow chamber with controlled distribution of wall fluid shear stress. Comput Biol Med. 2019; 106: 140-148.
- Bouwman AM, Bosma JC, Vonk P, Wesselingh JH, Frijlink HW. Which shape factor (s) best describe granules?. Powder Technol. 2004; 146(1-2): 66-72.
- McCarthy CA, Ahern RJ, Devine KJ, Crean AM. Role of drug adsorption onto the silica surface in drug release from mesoporous silica systems. Mol Pharm. 2018; 15(1): 141-149.
- Ali H, Saad R, Ahmed A, El-Haj B. Extemporaneous furosemide suspensions for pediatrics use prepared from commercially available tablets. Int J Pharm Pharm Sci. 2016; 5(2): 116.
- Waschke J, Pompe T, Rettke D, Schmidt S, Hlawitschka M. Radial profile detection of multiple spherical particles in contact with interacting surfaces. Plos one. 2019; 14(4): 0214815.
- Liu X, Yue S, Lu L, Gao W, Li J. Study of single-particle residence time in impulse, symmetric and asymmetric coaxial impinging streams. Powder Technol. 2019; 342: 118-130.
- Phan‐Quang GC, Lee HK, Phang IY, Ling XY. Plasmonic colloidosomes as three‐dimensional SERS platforms with enhanced surface area for multiphase sub‐microliter toxin sensing. Chem Int Ed Engl. 2015; 127(33): 9827-9831.
- Oh JM, Hong CI, Lim JW. Comparison of deoxidation capability on the specific surface area of irregular titanium powder using calcium reductant. Adv Powder Technol. 2019; 30(1): 1-5.
- Ianoş R, Băbuţă R, Păcurariu C, Lazău R, Istratie R, Butaciu C. Combustion synthesis of ZnAl2O4 powders with tuned surface area. Ceram Int. 2017; 43(12): 8975-8981.
- Giri SD, Sarkar A. Estimating surface area of copper powder: A comparison between electrochemical, microscopy and laser diffraction methods. Adv Powder Technol. 2018; 29(12): 3520-3526.
- El-Haj BM, Al-Amri AM, Ali HS. GC-MS detection and tentative characterization of two noscapine metabolites in human urine and their potential as markers for opium and illicit heroin use. Forensic Toxicol. 2007; 25(1): 22-29.
- Hichri Y, Cerezo V, Do MT. Modeling of the surface coverage and application to the calculation of friction on surfaces contaminated by particles. Wear. 2019; 426: 1082-1093.
- Ali U, Esmaeilizadeh R, Ahmed F, Sarker D, Muhammad W, Keshavarzkermani A, et al. Identification and characterization of spatter particles and their effect on surface roughness, density and mechanical response of 17-4 PH stainless steel laser powder-bed fusion parts. Mater Sci Eng A. 2019; 756: 98-107.
- Madani SH, Arellano IH, Mata JP, Pendleton P. Particle and cluster analyses of silica powders via small angle neutron scattering. Powder Technol. 2018; 327: 96-108.
- Nosko M, Štepánek M, Zifčák P, Orovčík L, Nagy Š, Dvorák T, et al. Solid-state joining of powder metallurgy Al-Al2O3 nanocomposites via friction-stir welding: Effects of powder particle size on the weldability, microstructure, and mechanical property. Mater Sci Eng A. 2019; 754: 190-204.
- Yohannes B, Liu X, Yacobian G, Cuitiño AM. Particle size induced heterogeneity in compacted powders: Effect of large particles. Adv Powder Technol. 2018; 29(12): 2978-2986.
- Shah UV, Wang Z, Olusanmi D, Narang AS, Hussain MA, Tobyn MJ, et al. Effect of milling temperatures on surface area, surface energy and cohesion of pharmaceutical powders. Int J Pharm. 2015; 495(1): 234-240.
- Suliman RS, Ali H, Nurulain I, NurShamiha N, Nizam M, Budiasih S, et al. Cinnamon bark extract for the formulation and characterisation of antimicrobial cream. Inter J Res Ayurveda Pharm. 2017; 8(2): 200-206.
- Chou HT, Chou SH, Hsiau SS. The effects of particle density and interstitial fluid viscosity on the dynamic properties of granular slurries in a rotating drum. Powder Technol. 2014; 252: 42-50.
- Liao CC. A study of the effect of liquid viscosity on density-driven wet granular segregation in a rotating drum. Powder Technol. 2018; 325: 632-638.
- Härtl J, Ooi JY. Experiments and simulations of direct shear tests: porosity, contact friction and bulk friction. Granul Matter. 2008; 10(4): 263.
- Jange CG, Ambrose RK. Effect of surface compositional difference on powder flow properties. Powder Technol. 2019; 344: 363-372.
- Goh HP, Heng PW, Liew CV. Comparative evaluation of powder flow parameters with reference to particle size and shape. Int J Pharm. 2018; 547(1-2): 133-141.
- Holm R, Borkenfelt S, Allesø M, Andersen JE, Beato S, Holm P. Investigation of surface porosity measurements and compaction pressure as means to ensure consistent contact angle determinations. Int J Pharm. 2016; 498(1-2): 355-361.
- Pawar P, Joo H, Callegari G, Drazer G, Cuitino AM, Muzzio FJ. The effect of mechanical strain on properties of lubricated tablets compacted at different pressures. Powder Technol. 2016; 301: 657-664.
- Koebernick N, Daly KR, Keyes SD, Bengough AG, Brown LK, Cooper LJ, et al. Imaging microstructure of the barley rhizosphere: particle packing and root hair influences. New Phytol. 2019; 221(4): 1878-1889.
- Garg V, Mallick SS, García-Trinanes P, Berry RJ. An investigation into the flowability of fine powders used in pharmaceutical industries. Powder Technol. 2018; 336: 375-382.
- Abdullah EC, Geldart D. The use of bulk density measurements as flowability indicators. Powder Technol. 1999; 102(2): 151-165.
- Youd TL. Factors controlling maximum and minimum densities of sands. Evaluation of relative density and its role in geotechnical projects involving cohesionless soils. 1973.
- Wong AC. Characterisation of the flowability of glass beads by bulk densities ratio. Chemical Engineering Science. 2000; 55(18): 3855-3859.
- Abdullah EC, Geldart D. The use of bulk density measurements as flowability indicators. Powder Technol. 1999; 102(2): 151-165.
- Santomaso A, Lazzaro P, Canu P. Powder flowability and density ratios: the impact of granules packing. Chem Eng Sci. 2003; 58(13): 2857-2874.
- Cho G, Dodds J, Santamarina J. Santamarina Particle shape effects on packing density, stiffness, and strength: natural and crushed sands. J Geotech Geoenv. 2006; 132: 591-602.
- El-Haj B, Al-Amri A, Ali H. Cross-reactivity of nefopam and its metabolites with benzodiazepine EMIT immunoassay. J Anal Toxicol. 2008; 32(9): 790-792.
- Stranzinger S, Faulhammer E, Li J, Dong R, Khinast JG, Zeitler JA, et al. Measuring bulk density variations in a moving powder bed via terahertz in-line sensing. Powder Technol. 2019; 344: 152-160.
- Meier C, Weissbach R, Weinberg J, Wall WA, Hart AJ. Modeling and characterization of cohesion in fine metal powders with a focus on additive manufacturing process simulations. Powder Technol. 2019; 343: 855-866.
- Saw HY, Davies CE, Paterson AH, Jones JR. Correlation between powder flow properties measured by shear testing and Hausner ratio. Procedia Eng. 2015; 102: 218-225.
- Etti CJ, Yusof YA, Chin NL, Tahir SM. Flowability properties of Labisia pumila herbal powder. Agric Agric Sci Procedia. 2014; 2: 120-127.
- Cheong FC, Xiao K, Pine DJ, Grier DG. Holographic characterization of individual colloidal spheres' porosities. Soft Matter. 2011; 7(15): 6816-6819.
- Härtl J, Ooi JY. Experiments and simulations of direct shear tests: porosity, contact friction and bulk friction. Granul Matter. 2008; 10(4): 263.
- Johnston LJ, Goihl J, Shurson GC. Selected additives did not improve flowability of DDGS in commercial systems. Appl Eng Agric. 2009; 25(1): 75-82.
- Nelson E. Measurement of the Repose Angle of aTablet Granulation. J Am Pharm Assoc. 1955; 44(7): 435-437.
- Ali I, Saifullah S, El‐Haj BM, Ali HS, Yasmeen S, Imran M, et al. Synthesis and Characterization of Sulfanilamide‐Based Nonionic Surfactants and Evaluation of Their Nano‐Vesicular Drug Loading Application. J Surfactants Deterg. 2020; 23(5): 973-980.
- Yang FG, Liu XN, Yang KJ, Cao SY. Study on the angle of repose of nonuniform sediment. J Hydrodyn Ser B. 2009; 21(5): 685-691.
- Castellanos A, Valverde JM, Pérez AT, Ramos A, Watson PK. Flow regimes in fine cohesive powders. Phy Rev Let. 1999; 82(6): 1156.
- Frączek J, Złobecki A, Zemanek J. Assessment of angle of repose of granular plant material using computer image analysis. J Food Eng. 2007; 83(1): 17-22.
- Zou RP, Yu AB. Evaluation of the packing characteristics of mono-sized non-spherical particles. Powder Technol. 1996; 88(1): 71-79.
- Salehi H, Barletta D, Poletto M. A comparison between powder flow property testers. Particuology. 2017; 32: 10-20.
- Yamane K, Tanaka T, Tsuji Y, Nakagawa M, Altobelli SA. DEM and MRI studies of particulate flows in a rotating cylinder. Flow Visu Image Proc Multiphase Sys. 1995.
- Fowler RT, Wyatt FA. The effect of moisture content on the angle of repose of granular solids. Aust J Chem Eng. 1960; 1: 5-8.
- Lee J, Herrmann HJ. Angle of repose and angle of marginal stability: molecular dynamics of granular particles. J Phys A Math Gen. 1993; 26(2): 373.
- Holsapple KA. Modeling granular material flows: The angle of repose, fluidization and the cliff collapse problem. Planet Space Sci. 2013; 82: 11-26.
- Chik Z, Vallejo LE. Characterization of the angle of repose of binary granular materials. Can Geotech J. 2005; 42(2): 683-692.
- Ghazavi M, Hosseini M, Mollanouri M. A comparison between angle of repose and friction angle of sand. 12th Int Conf Int Assoc Comput Methods Adv Geomech. 2008;1-6.
- Zaalouk AK, Zabady FI. Effect of moisture content on angle of repose and friction coefficient of wheat grain. Misr J Agric E ng. 2009; 26(1): 418-427.
Author Info
Ghazi ME Hussein1*, Babiker M Elhaj2 and Heyam Saad Ali32Department of Pharmaceutical Sciences, University of Science and Technology of Fujairah, Fujairah, UAE
3Department of Pharmaceutics, College of Pharmacy, University of Khartoum, Khartoum, Sudan
Received: 03-Jun-2021 Accepted: 17-Jun-2021 Published: 24-Jun-2021
Copyright: This is an open access article distributed under the terms of the Creative Commons Attribution License, which permits unrestricted use, distribution, and reproduction in any medium, provided the original work is properly cited.
ARTICLE TOOLS
- Dental Development between Assisted Reproductive Therapy (Art) and Natural Conceived Children: A Comparative Pilot Study Norzaiti Mohd Kenali, Naimah Hasanah Mohd Fathil, Norbasyirah Bohari, Ahmad Faisal Ismail, Roszaman Ramli SRP. 2020; 11(1): 01-06 » doi: 10.5530/srp.2020.1.01
- Psychometric properties of the World Health Organization Quality of life instrument, short form: Validity in the Vietnamese healthcare context Trung Quang Vo*, Bao Tran Thuy Tran, Ngan Thuy Nguyen, Tram ThiHuyen Nguyen, Thuy Phan Chung Tran SRP. 2020; 11(1): 14-22 » doi: 10.5530/srp.2019.1.3
- A Review of Pharmacoeconomics: the key to “Healthcare for All” Hasamnis AA, Patil SS, Shaik Imam, Narendiran K SRP. 2019; 10(1): s40-s42 » doi: 10.5530/srp.2019.1s.21
- Deuterium Depleted Water as an Adjuvant in Treatment of Cancer Anton Syroeshkin, Olga Levitskaya, Elena Uspenskaya, Tatiana Pleteneva, Daria Romaykina, Daria Ermakova SRP. 2019; 10(1): 112-117 » doi: 10.5530/srp.2019.1.19
- Dental Development between Assisted Reproductive Therapy (Art) and Natural Conceived Children: A Comparative Pilot Study Norzaiti Mohd Kenali, Naimah Hasanah Mohd Fathil, Norbasyirah Bohari, Ahmad Faisal Ismail, Roszaman Ramli SRP. 2020; 11(1): 01-06 » doi: 10.5530/srp.2020.1.01
- Manilkara zapota (L.) Royen Fruit Peel: A Phytochemical and Pharmacological Review Karle Pravin P, Dhawale Shashikant C SRP. 2019; 10(1): 11-14 » doi: 0.5530/srp.2019.1.2
- Pharmacognostic and Phytopharmacological Overview on Bombax ceiba Pankaj Haribhau Chaudhary, Mukund Ganeshrao Tawar SRP. 2019; 10(1): 20-25 » doi: 10.5530/srp.2019.1.4
- A Review of Pharmacoeconomics: the key to “Healthcare for All” Hasamnis AA, Patil SS, Shaik Imam, Narendiran K SRP. 2019; 10(1): s40-s42 » doi: 10.5530/srp.2019.1s.21
- A Prospective Review on Phyto-Pharmacological Aspects of Andrographis paniculata Govindraj Akilandeswari, Arumugam Vijaya Anand, Palanisamy Sampathkumar, Puthamohan Vinayaga Moorthi, Basavaraju Preethi SRP. 2019; 10(1): 15-19 » doi: 10.5530/srp.2019.1.3

